

 Português pt
 Español es
 العربية ar
 বাংলা bn
 Deutsch de
 Filipino fil
 Français fr
 हिन्दी hi
 Bahasa Indonesia id
 Italiano it
 Русский ru
 Svenska sv
 ไทย th
 Türkçe tr
 Tiếng Việt vi
 简体中文 zh
Updated:
IndicatorsBelkhayate Timing Indicator: What It Is, How to Calculate and Use It
 Naomi TanakaEditorial character · Analysis Desk

Quick answer
Belkhayate Timing is an oscillator that measures the distance between price and its equilibrium point over the last five candles, divided by the recent average range. Between −4 and +4 the market is in a neutral zone; above +8 or below −8, price is very stretched. Extreme readings are warnings of a possible reversal, not automatic signals.
Not every technical analysis indicator becomes a standard feature on trading platforms, and Belkhayate Timing is a good example. Created by trader Mustapha Belkhayate, it usually shows up as a custom indicator, not a built-in one.
The idea is to measure how far price has drifted from its recent "center," on a scale that lets you compare calm days and busy ones. To show how this works with real numbers, we use daily quotes for the Ibovespa between April and October 2026.
What Belkhayate Timing is
Belkhayate Timing is an oscillator that draws, in a separate panel, candles representing the distance between price and an equilibrium point from the last five periods. That distance is divided by a measure of the candles' recent range, which puts the indicator on an approximately fixed scale, marked at 0, ±4, and ±8.
The zones are usually read like this:
- Between −4 and +4 (neutral zone): price is near its recent center. The traditional reading is that there's no clear edge to enter.
- Between +4 and +8: price is stretched to the upside; a zone to watch for sells.
- Between −4 and −8: price is stretched to the downside; a zone to watch for buys.
- Above +8 or below −8: an extreme stretch, which the method treats as the strongest signal of a possible reversal.
Colors vary by platform, and some versions flip the convention. Before using it, check on your platform which side corresponds to price stretched upward.

How to calculate Belkhayate Timing
The exact formula was never published by the author, and the available versions differ in details. The most widespread version in open-source code works like this, for each candle:
- Center: average of the median price, (high + low) ÷ 2, of the last 5 candles.
- Scale: average range (high − low) of the last 5 candles, multiplied by 0.2.
- Timing = (price − center) ÷ scale, calculated for the open, high, low, and close, which forms the indicator's candle.
Example with the Ibovespa on October 7, 2026
The period's last five sessions had these highs and lows, in points: October 1 (187,437 and 184,768), October 2 (192,119 and 186,144), October 5 (209,606 and 192,138), October 6 (209,523 and 204,725), and October 7 (206,878 and 204,176).
- Median prices: 186,102.5; 189,131.5; 200,872; 207,124; 205,527 → average = 988,757 ÷ 5 = 197,751.4
- Ranges: 2,669; 5,975; 17,468; 4,798; 2,702 → average = 33,612 ÷ 5 = 6,722.4 → scale = 6,722.4 × 0.2 = 1,344.5
- October 7 close: 204,302 → Timing = (204,302 − 197,751.4) ÷ 1,344.5 = 4.9
A value of 4.9 puts the close in the +4 to +8 range: stretched to the upside relative to the previous five days, but outside the extreme zone.
Real example: Belkhayate Timing on the Ibovespa in 2026
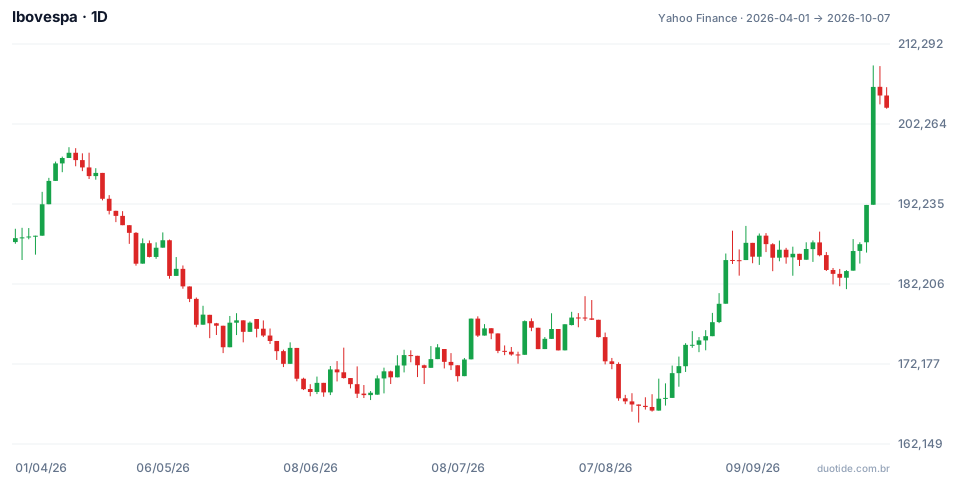
The chart shows the Ibovespa's daily candles; the Timing values cited below were calculated on those quotes. Over the period, the index rose from 187,953 to 204,302 points (8.7%), with a low of 164,835 on August 14 and a high of 209,606 on October 5. Of the 131 sessions, the close sat in the neutral zone on 72, or 55%. Above +8 there were 7 sessions; below −8, 5.
April: an upside extreme followed by a pullback
On April 10 Timing marked 9.9 with the Ibovespa at 197,324 points. Ten sessions later, the index was 3.9% lower. It was a case where the extreme reading came before a correction.
August: a downside extreme near the bottom
On August 11 Timing reached −10.9, with the index at 167,875 points. Over the next five sessions, the Ibovespa still fell another 0.9% and marked the period's low on August 14, at 164,835. Ten sessions after the signal, though, it was 4.0% higher. The signal came close to the bottom, but not at the exact bottom.
October: an upside extreme that didn't reverse
On October 2 Timing marked 9.8 with the index at 192,115 points. Anyone selling there would have seen the opposite: the next session, October 5, the Ibovespa closed at 206,912, and Timing went to 13.8. By October 7, the index was 6.3% above the signal's level. In strong moves, the indicator can stay above +8 while price keeps climbing.

How to use Belkhayate Timing
Avoid the neutral zone
Its main usefulness is telling you when not to trade. With more than half the sessions between −4 and +4, the indicator filters out much of the days with no clear edge.
Use extremes as a warning, not an order
Readings above +8 or below −8 show price far from its five-day center. That calls for attention, not an automatic entry against the move. Wait for a signal from price itself, like a reversal candle or a break of a recent low.
Combine it with channels and trend
The signal gets more consistent when price also touches a Bollinger Band, a support, or a relevant resistance. In a strong trend, prefer using only the extremes that favor the trend, like pullbacks to the −4 zone in an uptrend.
Limitations
The indicator only looks at five candles, so it reacts to every short swing. The lack of an official formula means values vary between platforms. And, like every oscillator, it knows nothing about news: the Ibovespa's jump on October 5 showed that an event can push price well beyond any zone.
Common mistakes when using Belkhayate Timing
- Automatically selling above +8 or buying below −8, without looking at the trend.
- Trading in the neutral zone, where the method itself says there's no edge.
- Assuming every version of the indicator uses the same formula and colors.
- Using the indicator alone, without support, resistance, or a channel.
- Forgetting that the Ibovespa examples describe what happened, not what will happen.
To practice, install a version of Belkhayate Timing on your demo account's platform, check whether it matches the calculation above, and log, over a few weeks, every move past ±8: date, price, and what happened five and ten periods later. Your own record is what will tell you whether the indicator adds anything to your method.
Practice before you risk. Open your Duotide account and test your ideas on the demo account with US$10,000 in virtual funds.
Create free accountUpdated:
Editorial character of the Duotide newsroom. Articles are written by the team with the help of artificial intelligence; prices and charts come from real market data. Explains charts, indicators and trading strategies: how they work, where they fail and how to test them first.
Was this article helpful?
Be the first to rate it.
Comments
- No comments yet. Be the first to comment.
Ready to put it into practice?
Open your account and practice on the demo account with US$10,000 in virtual funds, without risking money.
- Secure platformProtected login and identity verification
- Multilingual supportHelp available every day
- Free demo accountUS$10,000 virtual to practice
Trading involves the risk of losing the capital invested.
