

 Português pt
 Español es
 العربية ar
 বাংলা bn
 Deutsch de
 Filipino fil
 Français fr
 हिन्दी hi
 Bahasa Indonesia id
 Italiano it
 Русский ru
 Svenska sv
 ไทย th
 Türkçe tr
 Tiếng Việt vi
 简体中文 zh
Updated:
IndicatorsBest Technical Indicator Combinations: 3 Pairs That Complement Each Other
 Naomi TanakaEditorial character · Analysis Desk

Quick answer
The best technical indicator combinations bring together different families: a trend indicator (like the 50-period moving average or the MACD), a momentum one (like the RSI), and a volatility one (like the ATR or Bollinger Bands). That way each one answers a different question: direction, timing, and risk. Adding two indicators from the same family just repeats the same information.
After learning technical indicators one by one, it's natural to want to use several at once to gain confidence before an entry. The problem is that stacking similar indicators on the same chart tends to have the opposite effect: repeated signals, a cluttered screen, and the false sense that three lines agreeing are worth more than one.
In this guide, instead of made-up examples, we use real daily prices for the S&P 500 from March to October 2026 to show three combinations that answer different questions about the market, and what each one actually showed, including the times it failed.
What makes a good indicator combination
Technical indicators fall into families. Trend indicators (moving averages, MACD) say which way the price is going. Momentum indicators (RSI, stochastic) say whether the move is overextended. Volatility indicators (Bollinger Bands, ATR) say how much the price tends to swing. Two moving averages with similar periods, or the RSI with the stochastic, are almost the same information repeated. A useful combination brings together different families, so each indicator answers a question the other doesn't.
In practice, that means two or three indicators at most, each with a clear function: one sets the context, another picks the timing, and, where relevant, a third measures the risk.

Real example: three combinations on the S&P 500 in 2026
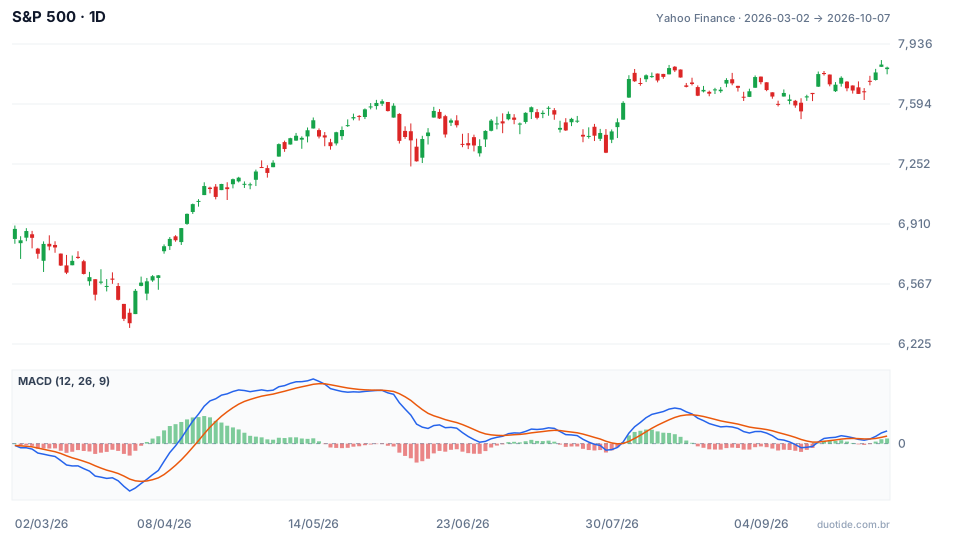
The chart shows the S&P 500 with the MACD (12, 26, 9) in the panel below. Over the period, the index went from 6,881.62 points on March 2, 2026 to 7,801.77 points on October 7, 2026, up 13.37%, with a low of 6,316.91 on March 30 and a high of 7,844.52 on October 6. The numbers below were calculated on these same prices.
Combination 1: the 50-period moving average with the RSI
The 50-day average answers the direction question: price above it, bullish bias; below it, bearish bias. The 14-period RSI answers the timing question: has the move already stretched too far, or has it pulled back enough?
On June 10, 2026, the S&P 500 closed at 7,266.99 points, still above the 50-day average (7,213.35), and the RSI pulled back to 40.6. That was a pullback within an uptrend, exactly the kind of situation this combination looks for. A month later, on July 10, the index was closing at 7,575.39 points, 4.2% higher.
The counterexample shows why the average matters. On March 20, the RSI dropped to 29.9, into oversold territory, with the index at 6,506.48 points, but the price was below the 50-day average (6,857.76). Anyone buying on the RSI alone saw the index drop another 2.5%, to 6,343.72 points on March 30. Oversold against the trend didn't have the average's confirmation.
Combination 2: MACD with Bollinger Bands
Bollinger Bands measure volatility: when the gap between the upper and lower bands shrinks, the market is compressed. The MACD shows when momentum turns. The combined reading looks for a bullish MACD crossover right after a period of narrow bands.
On July 27, 2026, the band width fell to 2.66% of the price, the narrowest of July. On August 3, the MACD crossed above its signal line with the index at 7,600.50 points, and on August 13 the S&P 500 closed at 7,798.99, up 2.6%. Ten sessions after the crossover, the gain was 1.9%.
The same reading in September delivered far less. The band width reached 2.13% on September 14 and the MACD crossed up on September 21, at 7,764.70 points. Ten sessions later, the index was only 0.12% higher, and along the way there was a bearish crossover on September 30. Compression says a move may be coming, but it doesn't guarantee its size.
Combination 3: the 9- and 21-period exponential averages with the ATR
The crossover between a fast exponential average (9 periods) and a slow one (21 periods) signals a short-term change in direction. The ATR (Average True Range) doesn't indicate direction: it measures the asset's average swing and serves to place the stop.
On September 21, 2026, the 9-day average (7,657.41) moved above the 21-day one (7,655.99), with the index closing at 7,764.70 points and the 14-day ATR at 70.58 points. The stop calculations look like this:
- Stop at 1.5 ATR: 1.5 × 70.58 = 105.87 points → 7,764.70 − 105.87 = 7,658.83
- Stop at 2 ATR: 2 × 70.58 = 141.15 points → 7,764.70 − 141.15 = 7,623.55
On September 30, the day's low was 7,651.54 points. The 1.5 ATR stop would have been hit by 7 points; the 2 ATR one held, and on October 7 the index closed at 7,801.77. A tight stop of 30 or 40 points would have been hit even earlier. The example doesn't say 2 ATR is always better: it says the stop's distance needs to respect the asset's normal swing, and that this choice changes the result.
How to use indicator combinations
Give each indicator a function
Before adding an indicator, write down the question it answers. If the answer is the same as another one already on screen, it's redundant. Average for direction, oscillator for timing, and ATR for risk is a split that works on almost any asset.
Set the reading order
Read from context to detail: trend first, then entry timing, and the stop last. Reversing the order, for example buying because the RSI is low and only then checking the average, is the shortest path to trading against the trend, as in March.
Test it before trusting it
Log 20 to 30 signals from the combination on the asset and time frame you use, with date, price, and what happened afterward. A small number of examples favors chance: the two MACD crossovers described above, one good and one weak, show how a small sample can mislead.
Limitations
All of these indicators are calculated from past price. They lag at sharp turns, know nothing about news, and can agree with each other and be wrong together. In a sideways market, averages and the MACD cross constantly; in a strong trend, oscillators sit in extreme zones for days.

Common mistakes when combining indicators
- Combining two indicators from the same family, like the RSI and the stochastic, and treating their agreement as confirmation.
- Adding a fourth or fifth filter every time a signal fails: the more filters, the fewer trades get through, and the later they arrive.
- Using the oscillator without checking the trend, as with the March oversold reading below the 50-day average.
- Setting the stop at a fixed distance, without factoring in the asset's ATR at that moment.
- Drawing conclusions from two or three examples: the cases above describe what happened, not what will happen.
To practice without risking money, pick one of the three combinations, set it up on a demo account with the asset you follow, and log every signal over a few weeks: date, price, where the stop would sit, and the result. This log shows whether the combination fits your trading style before any real money gets involved.
Practice before you risk. Open your Duotide account and test your ideas on the demo account with US$10,000 in virtual funds.
Create free accountUpdated:
Editorial character of the Duotide newsroom. Articles are written by the team with the help of artificial intelligence; prices and charts come from real market data. Explains charts, indicators and trading strategies: how they work, where they fail and how to test them first.
Was this article helpful?
Be the first to rate it.
Comments
- No comments yet. Be the first to comment.
Ready to put it into practice?
Open your account and practice on the demo account with US$10,000 in virtual funds, without risking money.
- Secure platformProtected login and identity verification
- Multilingual supportHelp available every day
- Free demo accountUS$10,000 virtual to practice
Trading involves the risk of losing the capital invested.
