

 Português pt
 Español es
 العربية ar
 বাংলা bn
 Deutsch de
 Filipino fil
 Français fr
 हिन्दी hi
 Bahasa Indonesia id
 Italiano it
 Русский ru
 Svenska sv
 ไทย th
 Türkçe tr
 Tiếng Việt vi
 简体中文 zh
Updated:
StrategiesBest Time Frame for Day Trading: 1, 5, or 15 Minutes?
 Naomi TanakaEditorial character · Analysis Desk

Quick answer
There's no ideal time frame for everyone in day trading. The 15-minute chart tends to be the best starting point for beginners, because it filters out a good deal of noise and leaves time to decide; the 5-minute chart works for fine-tuning the entry, and the 1-minute one requires experience. The most organized approach is to use three time frames: 1 hour for context, 15 minutes for the setup, and 5 minutes for the entry.
One of the first questions for anyone starting out in day trading is which chart to use: 1 minute, 5 minutes, 15 minutes, or something slower. There's no magic time frame that works for everyone. What exists is a trade-off between speed and noise, which changes depending on your style, the asset, and how much time you have to watch the session.
In this guide you'll see what each time frame delivers, how to set up a three-chart structure, and what real Tesla data from 2026 shows about candle size when you switch time frames.
What a time frame is
A time frame is the span of time each candle represents. On the 1-minute chart, each candle shows the open, high, low, and close over 60 seconds; on the 15-minute chart, over a quarter of an hour. The price is the same; what changes is the amount of detail on screen. Switching time frames doesn't make the market more predictable, it just filters more or less noise.
- 1 and 5 minutes: more signals and faster entries, with more noise, more emotional pressure, and a higher cost relative to the target.
- 15 and 30 minutes: fewer signals, a cleaner structure, and more time to decide.
- 1 hour: rarely used for the entry itself, but useful for knowing the day's trend and the main levels.

Who each time frame suits
The 1-minute chart works best for traders who have already set the direction on a slower chart and use the 1-minute one only to fine-tune the entry point. For beginners, it turns every wiggle into a false signal.
The 5-minute chart is a middle ground: it still generates plenty of opportunity, but it filters out some of the noise. It works well paired with a larger chart that provides context.
The 15-minute chart tends to be the most recommended starting point for beginners. Signals take longer to show up, but there's time to evaluate the trade before entering.
The 30-minute chart suits anyone who can't watch the market all day. The 1-hour chart works as a backdrop: it shows whether the market is trending or sideways, and where the day's support and resistance levels sit.
Real example: the size of Tesla's candles
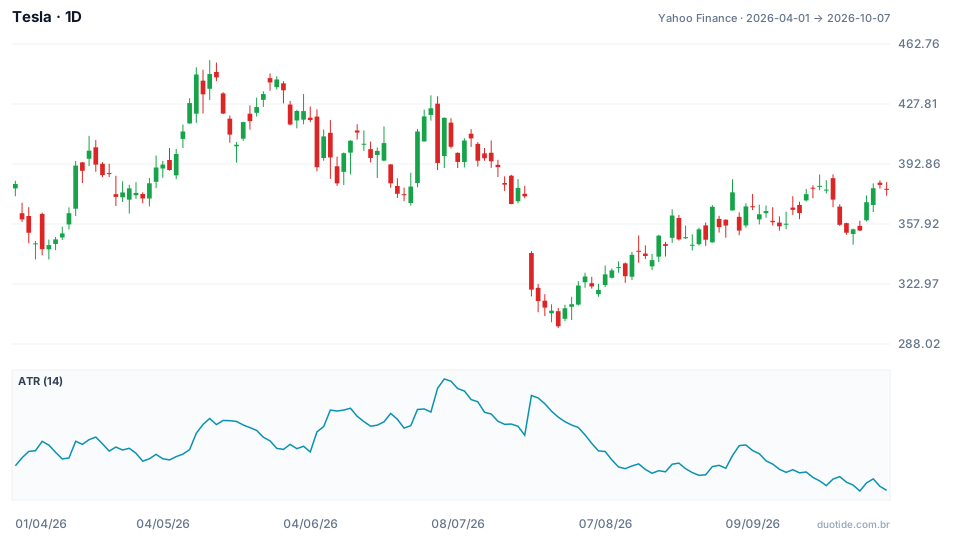
The chart shows Tesla on the daily, from April 1 to October 7, 2026, with the 14-period ATR, which measures each candle's average swing. The stock started the period at $381.26 and ended at $377.81, nearly flat, but along the way it went from $453.40 (a high on May 13) to $297.38 (a low on July 29). The data is daily and weekly, but the logic applies to intraday time frames too.
Bigger time frame, bigger candle, but not in the same proportion
Between April 6 and October 2, 2026, the average distance between each day's high and low was $14.04. Grouping the same sessions into 26 weeks, the average weekly range was $34.96, about 2.5 times a day's range, not 5 times, even though a week has five sessions. Part of each day's move gets undone the next day: that's the noise the larger time frame filters out. The same holds true going from 1 to 5 minutes, or from 5 to 15.
The same time frame changes from one month to the next
Tesla's daily ATR reached $20.32 on July 6, about 4.8% of the $419.77 price. On October 1 it was at $11.82, about 3.3% of the $354.11 price. A stop that fit comfortably in July would have been too wide in October, and a stop designed for October would have been run over by July's noise. The time frame alone doesn't set the stop's distance: the moment's volatility matters too.
No time frame avoids a price gap
On July 23, Tesla opened at $341.00, 8.8% below the previous day's close ($374.01), and closed at $319.69, down 14.5%. For anyone trading on the 1-minute chart, the gap was already there in the day's first candle. A faster chart doesn't protect against a jump that happens while the market is closed.

How to build a three-time-frame ladder
A simple way to organize the analysis is to use three charts, each with a function:
- 1 hour (context): decide whether the day is trending up, down, or sideways, and mark the main levels.
- 15 minutes (setup): look for the entry pattern within that context, such as a pullback to an important level.
- 5 minutes (entry): use it only to pick the moment to enter, once the two larger charts agree.
An example reading
A stock rises on the 1-hour chart, with higher lows. On the 15-minute chart, the price pulls back to a region that used to be resistance and stops making lower highs. On the 5-minute chart, the trigger is a candle closing above a recent high, with the stop below the 15-minute chart's low, not below an isolated wick on the 5-minute chart.
Adjust the stop to the time frame
The smaller the time frame, the smaller the ATR and the shorter the technical stop, which allows a larger position for the same dollar risk. In exchange, each trade's costs weigh more relative to the target, and the number of false signals goes up. Always calculate the position size from the stop's distance.
Limitations
No time frame guarantees a result. Fast charts suffer more from spread and noise; slow charts enter later. And price gaps, like the one on July 23, blow right past any time-frame choice.
Common mistakes when choosing a time frame
- Starting with the 1-minute chart without having set the direction on a larger chart.
- Opening six or seven time frames at once, which creates more doubt than clarity.
- Switching time frames mid-trade to justify a losing position.
- Using the same stop in cents on any time frame and in any volatility phase.
- Forgetting the costs: on the 1-minute chart, commissions and spread can be a big chunk of the target.
- Drawing conclusions from a handful of days: the numbers above describe what happened, not what will happen.
To practice, start with the 15-minute chart with the 1-hour as context, and use the 5-minute one only once you have more experience. Trade on a demo account for a few weeks and record, for every trade, all three time frames, the stop's distance, and the result. The log shows which combination fits your pace before you risk any real money.
Practice before you risk. Open your Duotide account and test your ideas on the demo account with US$10,000 in virtual funds.
Create free accountUpdated:
Editorial character of the Duotide newsroom. Articles are written by the team with the help of artificial intelligence; prices and charts come from real market data. Explains charts, indicators and trading strategies: how they work, where they fail and how to test them first.
Was this article helpful?
Be the first to rate it.
Comments
- No comments yet. Be the first to comment.
Ready to put it into practice?
Open your account and practice on the demo account with US$10,000 in virtual funds, without risking money.
- Secure platformProtected login and identity verification
- Multilingual supportHelp available every day
- Free demo accountUS$10,000 virtual to practice
Trading involves the risk of losing the capital invested.
