

 Português pt
 Español es
 العربية ar
 বাংলা bn
 Deutsch de
 Filipino fil
 Français fr
 हिन्दी hi
 Bahasa Indonesia id
 Italiano it
 Русский ru
 Svenska sv
 ไทย th
 Türkçe tr
 Tiếng Việt vi
 简体中文 zh
Updated:
IndicatorsBollinger Bands: What They Are, How to Calculate and Use Them
 Naomi TanakaEditorial character · Analysis Desk

Quick answer
Bollinger Bands are three lines around the price: a 20-period simple moving average in the middle, and two bands set 2 standard deviations away, above and below. They widen when volatility rises and narrow when it falls. Touching or closing outside a band is not an automatic reversal signal: in a strong trend, the price can hug the band for several days.
Created by John Bollinger in the 1980s, Bollinger Bands belong to a small group of indicators that adjust themselves to an asset's volatility, instead of using a fixed price distance. That's why they show up on almost every charting platform, from forex to stocks. In this guide, instead of made-up numbers, we use real daily gold quotes (the GC=F futures contract, in dollars per ounce, from Yahoo Finance) between April and October 2026 to show how the indicator is calculated and what it actually showed.
The core idea is simple: price spends most of its time close to its recent average, and the bands show how far it typically strays from that average. What changes from one market to another, and from one week to the next, is that distance.
What Bollinger Bands are
The indicator is made up of three lines. The middle one is a simple moving average, usually over 20 periods. The other two sit above and below it, at a distance of two standard deviations from the closing price over that same period.
Standard deviation is a statistical measure of dispersion: the more recent closes have varied around the average, the higher the value. That's why the bands breathe. They widen when the market speeds up and narrow when the price settles into a tight range. On a daily chart, 20 periods is roughly a month of trading sessions; on a 1-hour chart, the last 20 hours.

How to calculate Bollinger Bands
The standard setup has three steps:
- Middle band: simple average of the last 20 closes.
- Standard deviation: calculated over those same 20 closes.
- Upper and lower bands: middle band plus and minus 2 standard deviations.
Example with real gold data
On October 7, 2026, gold closed at US$ 4,140.70. The average of the previous 20 closes (including that day) was US$ 4,289.74, and the standard deviation of those 20 closes was about US$ 100.91.
- Upper band = 4,289.74 + 2 × 100.91 = US$ 4,491.56
- Lower band = 4,289.74 − 2 × 100.91 = US$ 4,087.92
- Band width = (4,491.56 − 4,087.92) ÷ 4,289.74 = 9.41% of the average
Width as a percentage is the most useful measure for comparing different moments. On April 1, 2026, right after a turbulent stretch, it reached 24.5%. On August 4, 2026, it fell to 4.50%, the lowest of the entire chart window. Same asset, same setup, bands five times tighter.
Real example: Bollinger Bands on gold in 2026
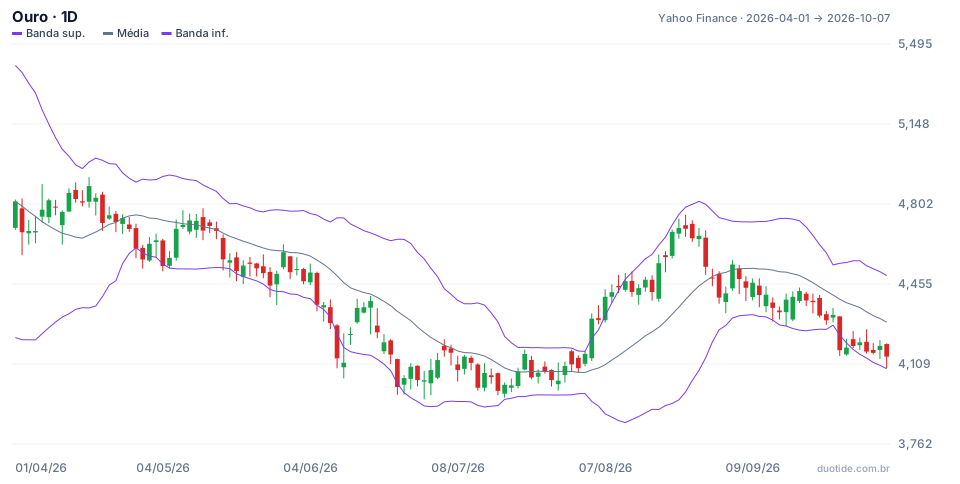
Between April 1 and October 7, 2026, gold went from US$ 4,813.10 to US$ 4,140.70, a drop of 13.97%, with a high of US$ 4,917.70 on April 17 and a low of US$ 3,955.40 on June 30. Three stretches of the chart show clearly what the indicator does and doesn't do.
June: closing below the lower band didn't mark the bottom
On June 9, 2026, gold closed at US$ 4,286.40, below the lower band. Anyone treating that as a buy signal because it looked cheap watched the price keep falling: there were further closes below the band on June 10, June 11, and June 24, and on June 24 the close was US$ 4,008.80, 6.5% below the first signal. The period's low only came on June 30. Closing outside the band shows the drop was strong, not that it's over.
July and August: the squeeze before the breakout
From mid-July through early August, band width stayed near 5%, with closes stuck between US$ 3,992.10 and US$ 4,152.60. On August 4, the width hit a low of 4.50%. The next day, August 5, gold closed at US$ 4,305.20, up 3.7% from the day before and above the upper band. The move continued: on August 24, the close was US$ 4,697.80, 13.1% above the August 4 close. The squeeze warned that volatility was too low; the direction only became clear at the breakout.
August: walking the upper band
Between August 5 and August 11, gold closed above the upper band for five sessions in a row. Selling on every touch, on the idea that the band is a ceiling, would have meant fighting a rally that still had two more weeks to run. Bollinger himself described this walk along the band as a sign of strength, not exhaustion.

How to use Bollinger Bands
Measure relative volatility
Band width tells you whether the market is calmer or more agitated than normal for that asset. Widths near the low of the past few months signal compression; widths near the high, an already-stretched market.
Trade the squeeze with confirmation
Traders who use the squeeze usually wait for a close outside one of the bands, preferably with volume, to define the side, instead of trying to guess the direction before the breakout. A stop on the other side of the compression range limits the loss when the breakout is false.
Read the move back inside the bands
A touch on the band followed by a close back inside, with a reversal candle, carries different information than a price that closes outside and keeps moving away. In a sideways market, the move back inside tends to bring the price back toward the middle average; in a trend, it may just be a pause.
Adjust the parameters carefully
Shorter periods (10, for example) make the bands more sensitive; smaller multipliers (1.5) narrow the channel and generate more touches, with more false signals. Change one parameter at a time and test it first.
Limitations
The bands use only past price and don't indicate direction. The standard deviation also reacts to a single extreme day, which suddenly widens the bands and keeps them wide for 20 periods, until that day drops out of the calculation.
Common mistakes when using Bollinger Bands
- Treating the upper band as a sell order and the lower band as a buy order, without looking at the trend.
- Entering before the squeeze breaks out, trying to guess the direction.
- Comparing band width between different assets as if it were the same scale.
- Using the indicator alone, without support, resistance, volume, or an oscillator like the RSI.
- Forgetting that the examples above describe what happened, not what will happen.
To practice without risking money, open the chart of the asset you follow on a demo account, add Bollinger Bands (20, 2), and note, over a few weeks, the band width and what the price did after each close outside them. That record shows how the indicator behaves in your market, not in a textbook example.
Practice before you risk. Open your Duotide account and test your ideas on the demo account with US$10,000 in virtual funds.
Create free accountUpdated:
Editorial character of the Duotide newsroom. Articles are written by the team with the help of artificial intelligence; prices and charts come from real market data. Explains charts, indicators and trading strategies: how they work, where they fail and how to test them first.
Was this article helpful?
Be the first to rate it.
Comments
- No comments yet. Be the first to comment.
Ready to put it into practice?
Open your account and practice on the demo account with US$10,000 in virtual funds, without risking money.
- Secure platformProtected login and identity verification
- Multilingual supportHelp available every day
- Free demo accountUS$10,000 virtual to practice
Trading involves the risk of losing the capital invested.
