

 Português pt
 Español es
 العربية ar
 বাংলা bn
 Deutsch de
 Filipino fil
 Français fr
 हिन्दी hi
 Bahasa Indonesia id
 Italiano it
 Русский ru
 Svenska sv
 ไทย th
 Türkçe tr
 Tiếng Việt vi
 简体中文 zh
Updated:
StrategiesBreakout Strategy: What It Is and How It Works
 Naomi TanakaEditorial character · Analysis Desk

Quick answer
A breakout is the strategy of entering when price exits a consolidation range, above resistance or below support, betting the move continues. The most common entries wait for the candle to close outside the range with above-average volume, with a stop just back inside it. Many breakouts fail, so the risk of each entry needs to be calculated beforehand.
When price stays stuck in a range for weeks and then suddenly breaks out of it with force, many people see the start of a new move. The breakout strategy tries to enter exactly at that exit. It's simple to describe and hard to execute well, because a good share of breakouts go right back inside the range shortly after.
In this guide we use real daily quotes for the Ibovespa between June and October 2026 to show a breakout that worked, one that failed, and how to calculate the risk of each entry before pulling the trigger.
What a breakout is
A breakout happens when price moves past a level that had been acting as a limit: resistance (a ceiling price couldn't get above) or support (a floor it couldn't fall below). The idea behind the strategy is that, once that limit is broken, the asset tends to keep moving in the same direction for a while, because orders that had piled up above the ceiling or below the floor get filled all at once.
These levels tend to form when price tests the same region several times without getting through. The more tests and the longer the consolidation, the more people start watching that level, and the more relevant it becomes.

How to measure the breakout and the target
Before any entry, three numbers need to be on paper:
- Top and bottom of the range: the highest high and the lowest low of the consolidation period.
- Height of the range: top minus bottom. A common target reference is to project that height from the breakout point.
- Stop: the point where the breakout stops making sense, usually just back inside the range.
Real example: the Ibovespa breakout in October 2026
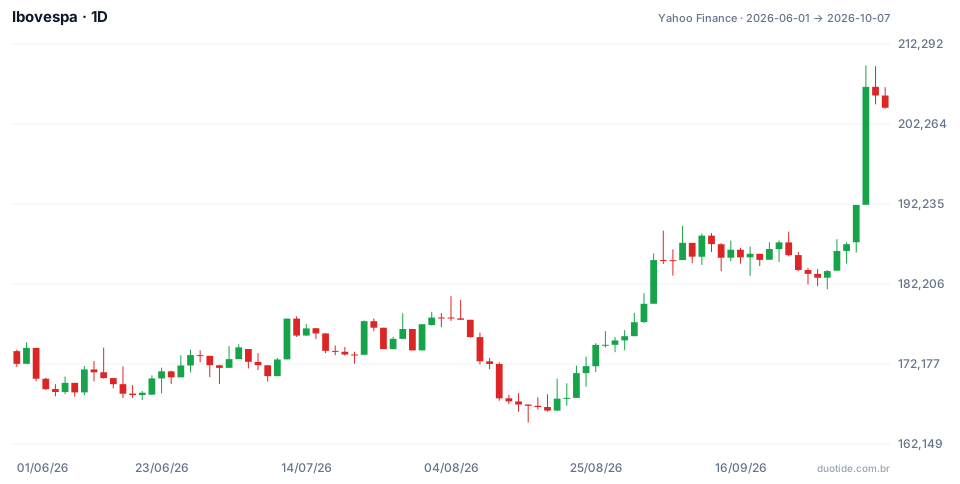
The chart shows the Ibovespa from June 1, 2026 (172,198 points) to October 7, 2026 (204,302 points). Two situations illustrate well what the strategy does and what it doesn't guarantee.
August: the breakout that didn't confirm
Between July 1 and August 3 the index didn't clear the high of 178,719 points, set on July 31. On August 4 it reached 180,680 points intraday, above the ceiling, but closed at 177,895, back inside the range. The next day the scene repeated: a high of 180,195 and a close of 177,726. Anyone who bought on the touch saw the index close at 167,101 points on August 13, 6.1% below the August 4 close, with the period's low coming on August 14, at 164,835 points. It's the picture of a false breakout: price moved past the level but didn't hold even into the close.
September and October: the range and the exit
From September 3 to October 1 the Ibovespa stayed between 181,562 points (the low on September 29) and 189,488 points (the high on September 8), a range of 7,926 points. On October 2 it closed at 192,115 points, 1.4% above the top of the range, with volume of 13.2 million by Yahoo Finance's count, about 1.44 times the average of the previous 20 sessions (9.15 million). This time the breakout came with a close outside the range and above-average volume.
In the next session, October 5, the index opened at 192,138, reached 209,606 points, and closed at 206,912, up 7.7% in a single day, with volume 3.1 times the average. The projected target from the range's height off the top (189,488 + 7,926 = 197,414 points) was already reached that same day. On October 7 the index closed at 204,302, still 6.3% above the breakout close.
Calculating the risk on this entry
Suppose someone traded B3's mini index futures contract, where each point is worth R$0.20, using the spot index points as an approximation. Entry at the October 2 close, at 192,115 points, with a stop at 189,000, just below the old top:
- Risk per contract: 192,115 − 189,000 = 3,115 points × R$0.20 = R$623.00
- R$40,000 account with a maximum risk of 2% per trade: R$800.00 → 800 ÷ 623 = 1.28 → 1 contract
- Target from the range's height: 197,414 − 192,115 = 5,299 points × R$0.20 = R$1,059.80
- Risk-reward ratio: 1,059.80 ÷ 623.00 = 1.7 to 1
This result describes what happened in that specific case. The same calculation applied to the August breakout would have ended at the stop.

How to use the breakout strategy
Wait for the close
The August example shows why: price moved past the ceiling intraday and came back before the close. Waiting for the candle to close outside the range removes part of the false breakouts, at the cost of entering a bit later.
Watch the volume
A breakout with volume above the recent average signals more participants deciding the move. On August 4 volume was 1.19 times the average; on October 2, 1.44 times, and the next day, 3.1 times. Volume guarantees nothing, but a breakout on weak volume deserves more suspicion.
Prefer clear ranges
A range with several touches at the top and bottom, over weeks, is easier to measure and to defend with a stop. Breakouts from messy ranges, with scattered highs and lows, produce poorly placed stops.
Pullback to the broken level
Often price breaks out, comes back to test the old level from the outside, and only then continues. Traders who prefer a shorter stop wait for that retest. The downside is that, in strong breakouts like October's, the retest may never happen.
Limitations
A significant share of breakouts fail, and the strategy only holds up if the losses on false breakouts are smaller than the gains on the real ones. News-driven breakouts can gap past the stop without filling at the planned price. And the same range drawn by two different people rarely has exactly the same boundaries.
Common mistakes in the breakout strategy
- Buying on the first touch above resistance, before the close confirms it.
- Ignoring volume and treating every breakout as the same.
- Placing the stop too far away (at the bottom of the range) and trading a size that doesn't fit that risk.
- Moving the stop down when price comes back inside the range, hoping the breakout confirms later.
- Forgetting that the examples above describe what happened, not what will happen on the next breakout.
To practice without risking money, use a demo account: mark the ranges on the asset you follow, log every breakout with that day's volume, the entry, stop, and target calculated in advance, and record the result. After a few dozen cases, your own track record shows how many breakouts fail in your market, and whether the math adds up.
Practice before you risk. Open your Duotide account and test your ideas on the demo account with US$10,000 in virtual funds.
Create free accountUpdated:
Editorial character of the Duotide newsroom. Articles are written by the team with the help of artificial intelligence; prices and charts come from real market data. Explains charts, indicators and trading strategies: how they work, where they fail and how to test them first.
Was this article helpful?
Be the first to rate it.
Comments
- No comments yet. Be the first to comment.
Ready to put it into practice?
Open your account and practice on the demo account with US$10,000 in virtual funds, without risking money.
- Secure platformProtected login and identity verification
- Multilingual supportHelp available every day
- Free demo accountUS$10,000 virtual to practice
Trading involves the risk of losing the capital invested.
