

 Português pt
 Español es
 العربية ar
 বাংলা bn
 Deutsch de
 Filipino fil
 Français fr
 हिन्दी hi
 Bahasa Indonesia id
 Italiano it
 Русский ru
 Svenska sv
 ไทย th
 Türkçe tr
 Tiếng Việt vi
 简体中文 zh
Updated:
MarketsBull Market vs. Bear Market: How to Identify Each One
 Rafael AzevedoEditorial character · Markets Desk

Quick answer
A bull market is a prolonged phase of higher highs and higher lows; a bear market is the opposite, with lower highs and lower lows. By the most common convention, a 20% drop from the peak marks a bear market, and a 20% rise from the low marks a new bull market. The structure of highs and lows and the 50- and 200-day averages help identify each phase, always with some lag.
Every market moves in cycles, and two terms sum up the best-known phases: a bull market, when gains and optimism dominate for months, and a bear market, when losses and pessimism take over. Knowing which phase an asset is in, or at least having a reasonable read on it, changes how you trade.
In this guide you'll see the definitions the market uses, the signs that help recognize each phase, and one full real cycle: Microsoft, which fell nearly 35% between October 2025 and June 2026 and then rose 50% from the low.
What a bull market and a bear market are
A bull market is marked by higher highs and higher lows, sustained over months or years. Corrections happen, but they stop before breaking the previous relevant lows.
A bear market is the opposite: lower highs and lower lows. Recoveries lose steam before clearing the previous highs.
A convention widely used by the financial press defines a bear market as a drop of 20% or more from the last peak, and a new bull market as a rise of 20% or more from the low. Drops between 10% and 20% are usually called a correction. It's a practical yardstick, not a law: it only confirms the phase after much of the move has already happened.

How to calculate the 20% rule
Using Microsoft's real daily closes:
- Peak: $542.07 on October 28, 2025. The 20%-drop line: 542.07 × 0.8 = $433.66. The first close below it came on January 29, 2026, at $433.50.
- Low: $352.83 on June 25, 2026. Drop from the peak: 352.83 ÷ 542.07 − 1 = −34.9%.
- The 20%-rise line from the low: 352.83 × 1.2 = $423.40. The first close above it came on July 30, 2026, at $451.10.
Notice the lag: the bear market only became "official" three months after the peak, and the bull market, five weeks after the low.
Real example: Microsoft's cycle
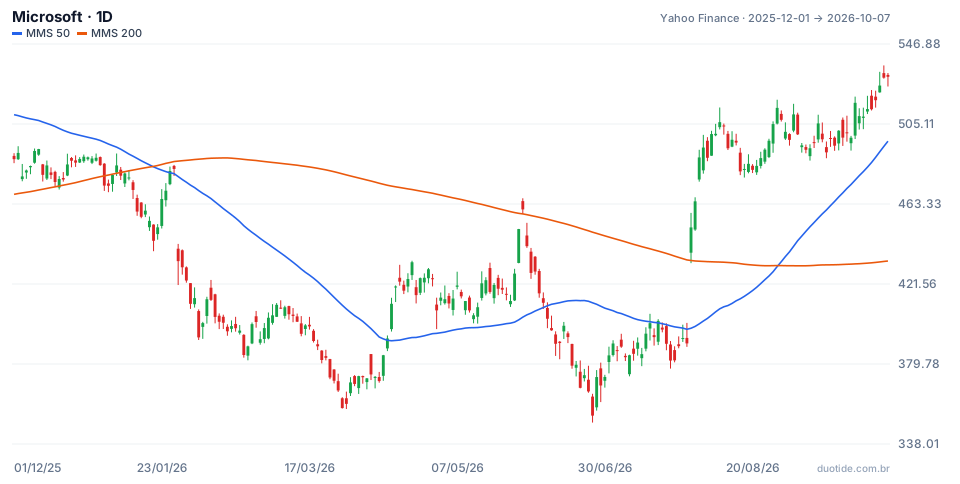
The chart shows Microsoft from December 1, 2025 to October 7, 2026 with the 50- and 200-day simple moving averages. Over the period, the stock went from a low of $349.20 on June 25 to a high of $535.69 on October 6. Three moments show how the phases can be recognized.
January: the 50-day average crosses below the 200-day
On January 21, 2026, the 50-day average crossed below the 200-day one, the so-called death cross, with the stock at $444.11. Ten sessions later it was at $414.19, down 6.74%. The monthly highs confirmed the bearish structure: $517.03 in November, $492.02 in December, $483.47 in January, $423.37 in February.
April to June: the rally that fooled everyone
From April 1 ($369.37) to June 1 ($460.52), the stock rose 24.7%, more than the rule's 20%, and even closed one day above the 200-day average ($458.16). It looked like the end of the bear market. It wasn't: on June 25 it closed at $352.83, down 23.4% in less than a month, below March's low ($356.77). A new, lower low kept the bearish structure intact. That's a bull trap: a strong recovery within a bear market.
July to October: higher lows and higher highs
On July 30, the stock rose 15.5% in a single session, from $390.54 to $451.10, and crossed the 20%-above-the-low line. From there, the monthly lows rose ($381.58 in July, $480.35 in August, $490.30 in September, $512.80 in early October), as did the highs ($513.53 in August, $516.17 in September, $529.76 on October 7). On August 31, the 50-day average crossed above the 200-day, at $507.29. On October 7, the stock was 50.1% above June's low.

How to identify the market's phase
The structure of highs and lows
This is the most direct signal. Rising highs and lows indicate a bull phase; falling ones, a bear phase. Microsoft's April-to-May rally didn't change the structure because the next low came in below the previous one.
Long-term moving averages
Price consistently above the 200-day average, with the 50-day above the 200-day, tends to reflect a bull market; the opposite, a bear market. The crossovers lag: Microsoft's bullish one came when the stock was already 44% above its low.
Reaction to news and breadth
In a bull market, bad news tends to produce short-lived drops; in a bear market, good news produces recoveries with no follow-through. On indices, it's worth checking how many stocks participate in the move, not just the biggest ones.
How to adjust your trading
In a bull market, many traders prioritize buying on pullbacks; in a bear market, selling on rallies or simply reducing exposure. Trading against the dominant phase requires stronger confirmation and a smaller position. Between one phase and the next there's usually a sideways stretch, where trend strategies perform worse.
Limitations
All of these readings happen after the fact. The 20% rule, the moving average crossovers, and the structure of highs and lows confirm the phase with a lag, and a strong recovery can be just a trap, as in May.
Common mistakes when identifying the market's phase
- Confusing a correction within a trend with a cycle change, or the other way around.
- Treating a rally of more than 20% within a bear market as the end of the drop without waiting for a higher low.
- Waiting for the 50- and 200-day average crossover as an entry signal, without considering how far the price has already moved.
- Ignoring the sideways stretch between phases and sticking with trend strategies when there's no trend.
- Forgetting that the example above describes what happened, not what will happen.
To practice, pick two or three assets on a demo account, mark each one's highs and lows on the daily chart, add the 50- and 200-day averages, and note every week which phase you think each one is in. Comparing those notes with what happened afterward is the best training for recognizing the phases in real time.
Practice before you risk. Open your Duotide account and test your ideas on the demo account with US$10,000 in virtual funds.
Create free accountUpdated:
Editorial character of the Duotide newsroom. Articles are written by the team with the help of artificial intelligence; prices and charts come from real market data. Follows the news that moves prices — rates, stock markets, companies and commodities — explained without jargon.
Was this article helpful?
Be the first to rate it.
Comments
- No comments yet. Be the first to comment.
Ready to put it into practice?
Open your account and practice on the demo account with US$10,000 in virtual funds, without risking money.
- Secure platformProtected login and identity verification
- Multilingual supportHelp available every day
- Free demo accountUS$10,000 virtual to practice
Trading involves the risk of losing the capital invested.
