

 Português pt
 Español es
 العربية ar
 বাংলা bn
 Deutsch de
 Filipino fil
 Français fr
 हिन्दी hi
 Bahasa Indonesia id
 Italiano it
 Русский ru
 Svenska sv
 ไทย th
 Türkçe tr
 Tiếng Việt vi
 简体中文 zh
Updated:
IndicatorsCCI: How to Calculate and Read Overbought and Oversold
 Naomi TanakaEditorial character · Analysis Desk

Quick answer
The CCI (Commodity Channel Index) is an oscillator that measures how far the price has strayed from its recent average, usually over 20 periods. Above +100 signals overbought; below −100, oversold. Since it has no fixed limit, very high or very low values show unusual moves, but they're not an automatic reversal signal: in a strong trend, the price can keep going.
The CCI, short for Commodity Channel Index, was introduced by Donald Lambert in 1980. Despite the name, it works on any asset with a price chart: stocks, indices, currencies, and cryptocurrencies. In this guide we use real daily quotes from the gold futures contract (GC=F, in dollars per troy ounce, from Yahoo Finance) between April and October 2026 to run the calculation and show what the indicator actually showed.
The difference between the CCI and the RSI or the stochastic is that it has no ceiling or floor. When the price makes an unusually large move, the CCI also goes far, and that's what makes it useful for measuring the intensity of a move.
What the CCI is
The CCI measures how far the current period's typical price has strayed from its recent average, using the average deviation of the last few periods as a ruler. A positive value means the price is above the average; a negative value, below. The bigger the number, in absolute terms, the more unusual the move away.
The most common period is 20. Lambert chose the constant 0.015 so that most readings would fall between −100 and +100. That's why these two lines became the reference levels for overbought (above +100) and oversold (below −100).

How to calculate the CCI
There are four steps:
- Typical price (TP): (high + low + close) ÷ 3, for each of the last 20 periods.
- Average TP: simple average of those 20 typical prices.
- Average deviation: average of the absolute distances between each TP and the average.
- CCI = (current TP − average TP) ÷ (0.015 × average deviation).
Example with real gold data
On August 6, 2026, gold futures had a high of US$ 4,363.70, a low of US$ 4,281.20, and closed at US$ 4,299.60. That day's calculation looks like this:
- Typical price for August 6 = (4,363.70 + 4,281.20 + 4,299.60) ÷ 3 = 4,314.83
- Average of the 20 typical prices from July 10 to August 6 = 4,090.77
- Average deviation of those 20 values from the average = 53.88
- CCI = (4,314.83 − 4,090.77) ÷ (0.015 × 53.88) = 224.06 ÷ 0.8082 ≈ 277
It was the highest 20-period CCI reading across the entire chart window. It happened because, over two sessions (August 5 and 6), the typical price jumped from about US$ 4,138 to more than US$ 4,314, after nearly a month hovering near US$ 4,000 to US$ 4,100. The average deviation was small, so a US$ 224 jump above the average turned into a huge CCI.
Real example: gold's CCI in 2026
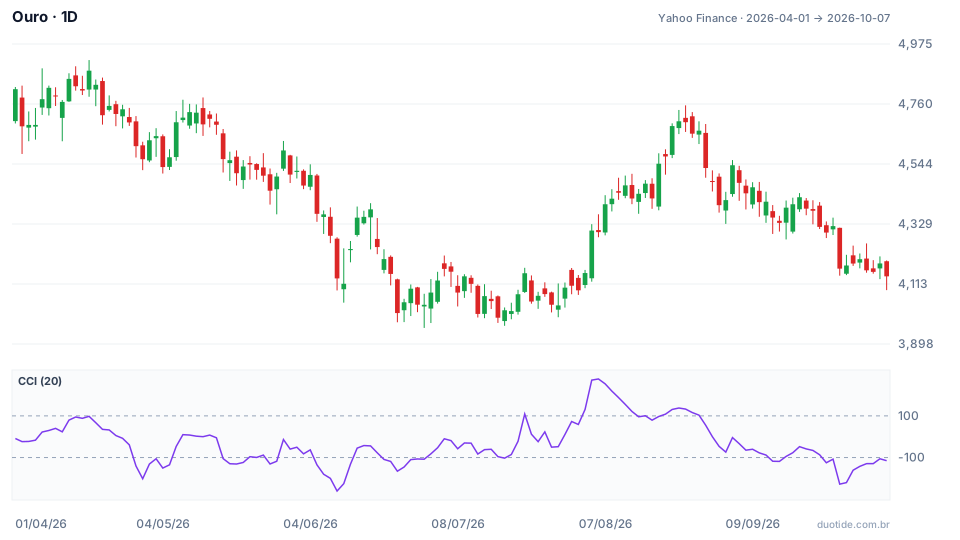
Between April 1 and October 7, 2026, gold fell 13.97%, from US$ 4,813.10 to US$ 4,140.70. Over that window the CCI crossed below −100 eight times and above +100 four times. Three moments show clearly what the indicator does and doesn't do.
June: extreme oversold that didn't mark the bottom
On June 10, the CCI reached −260.81, the period's lowest reading, with gold closing at US$ 4,133.30. There was a fast bounce: by June 15 the price was at US$ 4,351.60 (5.3% higher) and the CCI had come back to −54.8. But the drop wasn't over. Gold closed at US$ 4,008.80 on June 24 and made the window's low, US$ 3,955.40, on June 30. Strong oversold readings flagged an exaggerated short-term drop, not the end of the trend.
August: overbought at the start of a rally
The CCI crossed above +100 on August 4, with the price at US$ 4,152.60, and reached 277 on August 6. Anyone selling because they saw overbought would have left early: ten sessions after August 4, gold was at US$ 4,420.60 (up 6.45%), and the sequence's highest close came on August 24, at US$ 4,697.80, 9.3% above the August 6 close. At the start of a trend, a high CCI shows strength, not exhaustion.
September: oversold in the direction of the trend
On September 14, the CCI crossed below −100 again (−117.78), with the price at US$ 4,351.90. Ten sessions later, gold was at US$ 4,168.40, down 4.22%, and on October 7 it closed at US$ 4,140.70 with the CCI still at −115.09. Here the oversold reading matched the direction of the move: anyone treating −100 as a buy signal fought the decline.

How to use the CCI
CCI above +100
Shows the price is well above its recent average, with more strength than normal for that asset. In a sideways market, it tends to precede a pullback back into the range. At the start of a trend, as in August, it can be exactly the sign that the move has gained strength. Use it as a warning, not a sell order.
CCI below −100
It's the mirror case: the price has fallen more than usual. In a downtrend, the indicator can cross below −100 several times, as happened with gold between May and July. Very negative readings tend to come with short bounces, but they don't say when the drop ends.
Moving back inside the range
Many traders wait for the CCI to leave the extreme zone and move back inside the −100 to +100 range before considering a trade against the move. The return shows the momentum has lost strength, which is a more useful signal than simply entering the extreme zone. Even so, it's worth seeking confirmation in the price: a nearby support or resistance, a candle pattern, a short breakout.
Zero-line crossover
Another common reading treats the CCI above zero as the price being above its 20-period average and below zero as the price being below it. It's a simple way to filter the dominant direction before looking at the extreme zones.
Limitations
The CCI uses only past prices, so it lags on sharp changes and knows nothing about news. Since it has no limit, there's no value that signals the end of a move: 277 in August didn't stop another 9% rally. And the period changes the behavior a lot: with 14 periods the indicator gets jumpier and generates more signals; with 30, it gets slower.
Common mistakes when using the CCI
- Automatically selling when the CCI passes +100, or buying when it falls below −100, without looking at the trend.
- Thinking a very extreme CCI, like −260, guarantees an immediate reversal.
- Using the indicator alone, without support, resistance, or market context.
- Changing the period without testing first, and comparing readings from different periods as if they were the same.
- Forgetting that the examples above describe what happened, not what will happen.
To practice without risking money, open the chart of an asset you follow on a demo account, add the 20-period CCI, and log, over a few weeks, what the price did after each crossover of +100 and −100. That record shows how the indicator behaves on that asset better than any ready-made rule.
Practice before you risk. Open your Duotide account and test your ideas on the demo account with US$10,000 in virtual funds.
Create free accountUpdated:
Editorial character of the Duotide newsroom. Articles are written by the team with the help of artificial intelligence; prices and charts come from real market data. Explains charts, indicators and trading strategies: how they work, where they fail and how to test them first.
Was this article helpful?
Be the first to rate it.
Comments
- No comments yet. Be the first to comment.
Ready to put it into practice?
Open your account and practice on the demo account with US$10,000 in virtual funds, without risking money.
- Secure platformProtected login and identity verification
- Multilingual supportHelp available every day
- Free demo accountUS$10,000 virtual to practice
Trading involves the risk of losing the capital invested.
