

 Português pt
 Español es
 العربية ar
 বাংলা bn
 Deutsch de
 Filipino fil
 Français fr
 हिन्दी hi
 Bahasa Indonesia id
 Italiano it
 Русский ru
 Svenska sv
 ไทย th
 Türkçe tr
 Tiếng Việt vi
 简体中文 zh
Updated:
CryptoCrypto: How to Separate Rumor From Fact to Trade With Strategy
 Rafael AzevedoEditorial character · Crypto Desk

Quick answer
To separate rumor from fact in crypto, check the official source before acting, look at whether the move came with volume well above average, and give the news time to be confirmed or denied. A move supported by many participants tends to leave a trace in the volume and the OBV; a price spike on weak volume fits better with short-lived speculation. No filter eliminates the risk, but they keep you from trading on impulse alone.
Few markets produce as many rumors per minute as crypto. A post from a public figure, a rumor about a listing on a big exchange, a poorly translated piece of regulatory news: any of these triggers can move a digital asset's price within minutes, long before any official confirmation. To trade this market with any structure, separating rumor from fact matters as much as understanding an indicator.
In this guide we use real daily Ethereum quotes (ETH/USDT on Binance) between April and October 2026 to show how volume and the OBV help tell apart a move with broad participation from one with no real support.
Why rumors weigh so heavily on crypto
Unlike stocks of established companies, with decades of history and regulators watching every disclosure, much of the crypto market has concentrated liquidity and an investor base that's very active on social media. The narrative spreads faster than verification, and the price reacts to the narrative before the fact. The market also runs 24 hours a day, seven days a week, so a rumor can break in the middle of the night or on a Sunday, when fewer people are watching.
The most common types of rumor
- Unconfirmed partnership or listing: an image circulates suggesting a token will be listed on a major exchange, the price spikes, and hours later the exchange denies it.
- Meme coins: driven almost entirely by attention on social media, with gains and drops of dozens of percentage points on the same day.
- Regulatory rumors: an isolated piece of news about a country banning or allowing cryptocurrencies, often taken out of context, triggers a reaction before anyone reads the original source.

What the OBV is and why it helps
The OBV (on-balance volume) is an indicator that adds up the volume on up days and subtracts the volume on down days. If the price rises on strong volume, the OBV rises with it; if the price rises with few people buying, the OBV barely moves. The idea is simple: a move that a lot of people are behind leaves a trace in the volume.
Real example: Ethereum in 2026
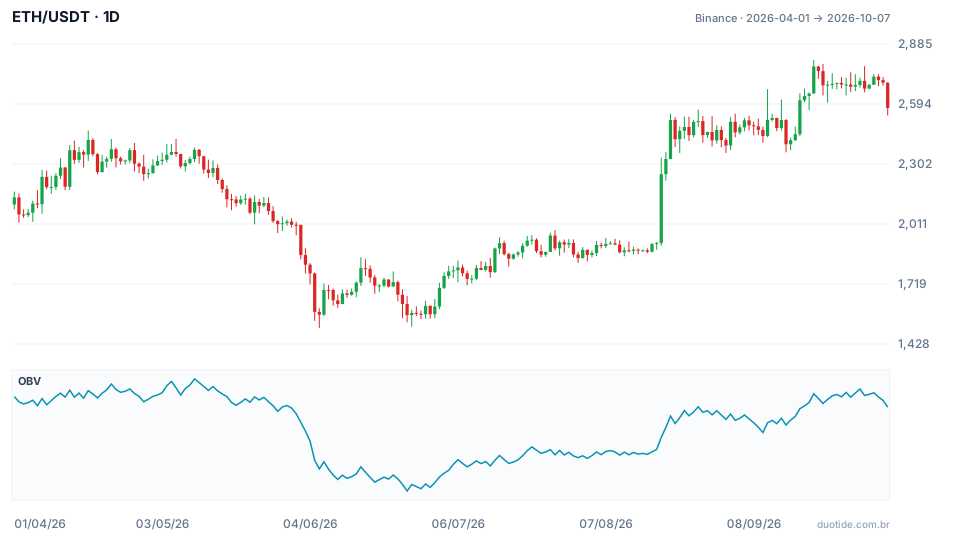
Over the chart's period, ETH went from US$2,140.35 on April 1, 2026, to US$2,574.14 on October 7, 2026, up 20.27%, passing through a low of US$1,505.68 on June 6 and a high of US$2,807.34 on September 21. Three situations show the role of volume.
Two strong rallies, very different volumes
On June 7 ETH rose 7.70% and closed at US$1,690.51, with volume of just 1.24 times the previous 20-day average. Five days later it was at US$1,666.41, down 1.43%. On August 19, meanwhile, the rally was 17.46%, up to US$2,252.80, with volume at 5.23 times the average. Five days later the price was at US$2,482.31, up 10.19%. The rally with heavy volume had follow-through in this case; the rally with ordinary volume didn't.
The decline with volume that didn't mark the bottom
On June 5 ETH fell 10.58%, to US$1,583.40, with volume at 4.24 times the average. The period's low came the next day, but the OBV kept falling until June 25, when it hit the period's lowest value (29.48 million ETH, with the price at US$1,567.84). Heavy volume shows participation; on its own, it doesn't indicate where the price is headed.
September: price above May's, OBV below
The OBV hit the period's highest value on May 10, at 36.81 million, with ETH at US$2,371.27. On September 21 the price closed at US$2,776.19, 17.1% above that day, but the OBV stood at 35.84 million, below May's peak. A higher price high with a lower OBV high is a divergence: September's rally happened with less net buying volume. On October 7 ETH closed at US$2,574.14, 7.28% below September 21. The divergence pointed to fading strength; it didn't say when or how much the price would fall, and the examples describe what happened, not what will happen.

How to filter rumors before trading
Check the source
Announcements from exchanges and projects come out on verified official channels, not just in screenshots shared by third parties. If you can only find the news on accounts reposting each other, it's still a rumor.
Compare the volume with the average
Before acting, compare the move's volume with the recent average. A 7% rally on normal volume, like the one on June 7, deserves more suspicion than a rally with five times the usual volume.
Wait for confirmation
Giving a rumor a few minutes or hours to be confirmed or denied costs little next to the risk of entering at the peak of a rumor. If the move is real, there will still be price left to trade.
Adjust the position size
Cryptocurrencies swing far more than stock indices: ETH fell 10.58% in a single day and rose 17.46% in another during the period analyzed. A position that would be reasonable in an index can be too large here. Set the stop beforehand and calculate the position so it represents a small loss of your capital.
Limitations
Crypto volume is fragmented across many exchanges, and the OBV from a single exchange shows only part of the market. The OBV also treats a day's entire volume as either buying or selling, based on the close, which is a simplification. Use it as confirmation, not as a trigger.
Common mistakes when trading crypto rumors
- Buying at the peak of news nobody has confirmed.
- Trusting a screenshot as if it were an official announcement.
- Ignoring volume and treating every strong rally as the start of a trend.
- Trading meme coins with the same position size as more liquid assets.
- Going without a stop because the market never closes, and waking up to a double-digit move.
- Assuming heavy volume guarantees direction: on June 5 volume was heavy and the price still fell.
To practice, open the ETH chart, or whatever asset you follow, on a demo account, add the OBV and a volume average, and log, for every strong move, whether it came with above-average volume and what the price did over the following five days. After a few weeks, your log will show how much volume helps with the asset you trade.
Practice before you risk. Open your Duotide account and test your ideas on the demo account with US$10,000 in virtual funds.
Create free accountUpdated:
Editorial character of the Duotide newsroom. Articles are written by the team with the help of artificial intelligence; prices and charts come from real market data. Covers cryptocurrencies and tokens: how these markets work and what changes when you trade them at a broker.
Was this article helpful?
Be the first to rate it.
Comments
- No comments yet. Be the first to comment.
Ready to put it into practice?
Open your account and practice on the demo account with US$10,000 in virtual funds, without risking money.
- Secure platformProtected login and identity verification
- Multilingual supportHelp available every day
- Free demo accountUS$10,000 virtual to practice
Trading involves the risk of losing the capital invested.
