

 Português pt
 Español es
 العربية ar
 বাংলা bn
 Deutsch de
 Filipino fil
 Français fr
 हिन्दी hi
 Bahasa Indonesia id
 Italiano it
 Русский ru
 Svenska sv
 ไทย th
 Türkçe tr
 Tiếng Việt vi
 简体中文 zh
Updated:
IndicatorsDPO (Detrended Price Oscillator): What It Is and How to Calculate It
 Naomi TanakaEditorial character · Analysis Desk
Quick answer
The DPO (Detrended Price Oscillator) compares the price from some periods back with a simple moving average, to remove the trend from the chart and reveal the short cycles underneath it. With 20 periods, it subtracts today's 20-day average from the close from 11 days ago. It doesn't tell you the trend's direction or give a signal on the current candle: it's a tool for measuring the duration and amplitude of cycles.
Almost every indicator tries to track the price as closely as possible to the latest candle. The DPO does the opposite on purpose: it gives up the present to show, more clearly, the highs and lows hidden inside a trend. It's a niche indicator, but useful for anyone who wants to know whether an asset oscillates in regular cycles.
In this guide we use real daily Microsoft (MSFT) quotes between March and October 2026 to show the calculation, what the indicator revealed, and where it failed.
What the DPO Is
In an uptrend, every pullback and every bounce is disguised by the chart's overall slope. The DPO removes that slope by comparing the price with a centered moving average, that is, an average that includes both the days before and the days after it. When the result is positive, the price was above the average of its surroundings; when it's negative, below.
Since the centered average needs days that come later, today's DPO value speaks about a price from roughly 11 trading days ago (with a 20-period setting). Some platforms draw the line shifted back, aligned with the price it refers to; others draw it on the day of the calculation. The math is the same.

How to Calculate the DPO
- Choose the period n, usually 20.
- Calculate the shift: n ÷ 2 + 1 = 11 trading days.
- Calculate the simple moving average of n periods for today.
- DPO = close from 11 trading days ago − today's 20-period average.
Example with Real Microsoft Data
On October 7, 2026, the simple average of Microsoft's last 20 closes was $506.62. Eleven trading days earlier, on September 22, the stock closed at $498.00. The DPO is 498.00 − 506.62 = −8.62: on September 22 the price was $8.62 below the average of its surroundings. Note that the October 7 close was $529.76, well above the average: the most recent DPO says nothing about that move, because it still looks back at September.
Another point: the 20-day average on June 16 was $417.16, and eleven trading days earlier, on June 1, the stock closed at $460.52. DPO of 460.52 − 417.16 = +43.36, the largest positive value in the window.
Real Example: Microsoft's Cycles in 2026
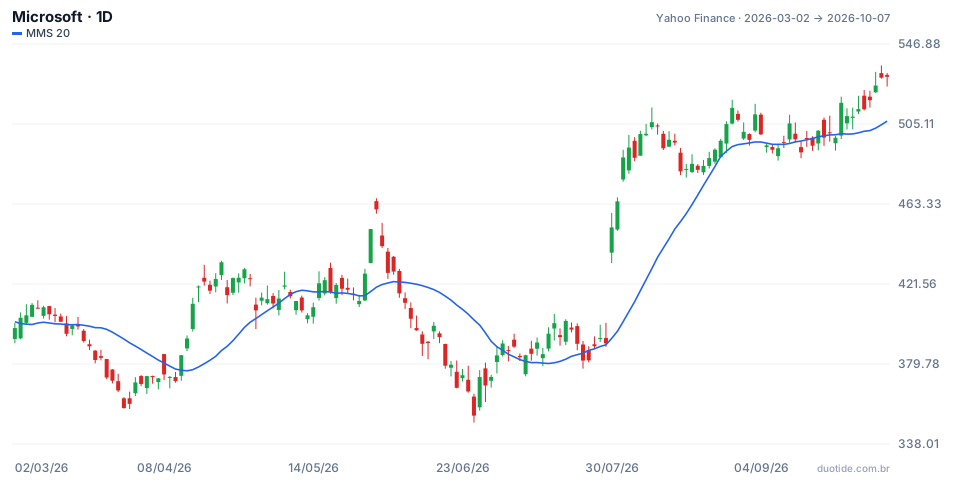
The chart shows the price with the 20-day simple average, which is the basis of the DPO. Over the period, the stock went from $398.55 (March 2) to $529.76 (October 7), a 32.9% gain, with a low of $349.20 on June 25 and a high of $535.69 on October 6. The DPO values quoted below are dated by the day of the price they refer to.
April to June: A Well-Defined Trough and Peak
The DPO marked a trough of −24.50 on April 10, with the stock at $370.87, and a peak of +43.36 on June 1, at $460.52. After the trough, the stock rose to $411.22 on April 15; after the peak, it pulled back to $416.67 on June 5. In this stretch, the indicator separated the cycle's extremes well from the overall rise.
July: The Jump That Distorted the Indicator
On July 30 the stock jumped from $390.54 to $451.10, a 15.5% gain in one day. The 20-day average then came to include that jump, and the DPO for July 29 dropped to −54.62, the lowest value in the window. There was no exceptional cycle trough there: there was a step in the price. Sharp moves, like the ones that follow quarterly earnings, inflate the DPO and create peaks and troughs that don't represent any cycle at all.
August and September: Short Cycles
After the jump, the DPO marked troughs on August 20 (−14.56, at $481.15) and on September 16 (−11.00, at $490.30), 18 trading days apart. Before that, the distorted trough from July 29 was 16 trading days before August 20. A 16-to-18-trading-day cycle showed up in this stretch, but it didn't repeat regularly across the whole six months: between the trough on April 10 and the one on July 29, the gap was much larger.

How to Use the DPO
Measure the Length of Cycles
Count the trading days between consecutive troughs (or between peaks). If the distance repeats, you have an estimate of the asset's cycle in that period, useful for calibrating trade durations and other indicators' periods.
See the Size of the Extremes
The DPO's values show how far the price usually strays from the average of its surroundings. If recent troughs stayed between −11 and −15, a DPO of −30 indicates an unusual move away from it, which deserves attention.
Combine It with the Trend
Since the DPO removes the trend, it doesn't tell you whether the asset is rising or falling. Use a longer average or the pattern of highs and lows for direction, and the DPO to understand the rhythm of the pullbacks within it.
Limitations
The indicator looks backward by design: today's value describes a price from 11 trading days ago. Price jumps distort the average and generate false readings, as in July. And in assets without a regular cycle, the peaks and troughs keep changing their spacing, and the count loses its usefulness.
Common Mistakes When Using the DPO
- Using the DPO as a buy or sell signal on the current candle, forgetting the 11-trading-day shift.
- Trying to read the trend's direction from an indicator built to remove it.
- Treating an extreme value caused by a price jump as a cycle trough.
- Concluding that a cycle exists from just two or three similar intervals.
- Comparing the DPO of assets with very different prices, since it's measured in money, not percentage.
To practice, add the 20-period DPO to the daily chart of an asset in your demo account and note down, over a few months, the date and value of each peak and trough. If the distance between them repeats, the indicator can help your planning; if not, you'll have found that out without risking money.
Practice before you risk. Open your Duotide account and test your ideas on the demo account with US$10,000 in virtual funds.
Create free accountUpdated:
Editorial character of the Duotide newsroom. Articles are written by the team with the help of artificial intelligence; prices and charts come from real market data. Explains charts, indicators and trading strategies: how they work, where they fail and how to test them first.
Was this article helpful?
Be the first to rate it.
Comments
- No comments yet. Be the first to comment.
Ready to put it into practice?
Open your account and practice on the demo account with US$10,000 in virtual funds, without risking money.
- Secure platformProtected login and identity verification
- Multilingual supportHelp available every day
- Free demo accountUS$10,000 virtual to practice
Trading involves the risk of losing the capital invested.
