

 Português pt
 Español es
 العربية ar
 বাংলা bn
 Deutsch de
 Filipino fil
 Français fr
 हिन्दी hi
 Bahasa Indonesia id
 Italiano it
 Русский ru
 Svenska sv
 ไทย th
 Türkçe tr
 Tiếng Việt vi
 简体中文 zh
Updated:
Technical analysisDiamond Pattern: What It Is, How to Identify It, and How to Trade It
 Naomi TanakaEditorial character · Analysis Desk

Quick answer
The diamond pattern is a reversal formation in which the price's swings first widen, with higher highs and lower lows, and then narrow, forming a rhombus shape. The top diamond shows up after rallies and is confirmed by a close below the lower-right line; the bottom one is its mirror. It's rare, subjective to draw, and fails often, which is why a stop and confirmation are indispensable.
The diamond is one of the least common chart patterns. It combines two phases that usually show up separately: a widening, in which the market gets more nervous and the swings increase, and a narrowing, in which the swings keep getting smaller until the price leaves the formation. The final shape looks like a sideways rhombus.
Because it's rare and depends heavily on where the lines are drawn, it's worth seeing how it shows up on a real chart. We used real daily S&P 500 index quotes (Yahoo Finance data) between April and August 2026, with the numbers for each point and what the index did afterward.
What the Diamond Pattern Is
The diamond has two halves:
- Left half (widening): each peak sits above the previous one and each trough, below. The lines connecting peaks and troughs open up, like in a broadening triangle.
- Right half (narrowing): the peaks start sitting below the highest peak and the troughs above the lowest trough. The lines converge, like in a symmetrical triangle.
Connecting the four sides forms the rhombus. The common read is growing indecision followed by settling down, which ends with the price choosing a direction.
Top Diamond
It shows up after an uptrend and suggests a reversal to the downside. It's confirmed when the price closes below the lower-right line, the one connecting the lowest trough to the rising troughs of the second half.
Bottom Diamond
It shows up after a decline and suggests a reversal to the upside. It's confirmed by a close above the upper-right line. It's even rarer than the top version.

How to Calculate the Diamond's Target
- Height = the pattern's highest high − lowest low (the widest part of the rhombus).
- Target = breakout point − height, for the top diamond; breakout point + height, for the bottom one.
Example with Real S&P 500 Numbers
- Highest high: 7,620.90 points on June 2, 2026
- Lowest low: 7,237.85 points on June 9, 2026
- Height = 7,620.90 − 7,237.85 = 383.05 points
- Breakout: close of 7,408.30 on July 23, below the July 8 low of 7,421.82
- Target = 7,408.30 − 383.05 = 7,025.25 points
Real Example: A Top Diamond in the S&P 500 in 2026
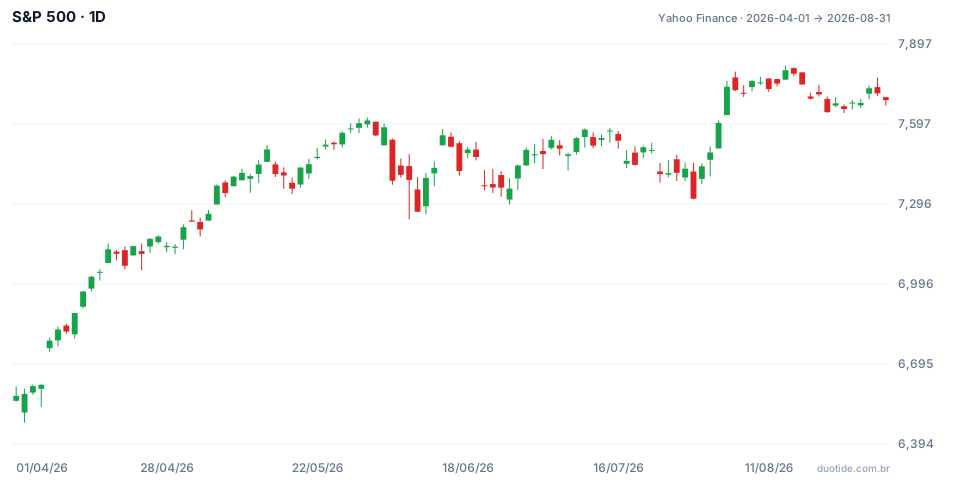
The S&P 500 started April at 6,575.32 points and rose 15.7% to the close of 7,609.78 on June 2. That rally is the context a top diamond requires. After it, the swings followed the pattern's shape, albeit imperfectly, as is almost always the case.
May and June: The Widening
On May 14 the index marked a high of 7,517.12 and, on May 19, a low of 7,333.68. It then made a higher peak, 7,620.90 on June 2, and a lower trough, 7,237.85 on June 9. In three weeks, the range between peak and trough went from about 183 to 383 points. That's the left half of the rhombus.
June and July: The Narrowing
The following peaks stayed below 7,620.90: 7,577.92 on June 15, 7,579.93 on July 10, and 7,581.50 on July 15. The troughs stayed above 7,237.85 and kept rising: 7,294.18 on June 26 and 7,421.82 on July 8. The second half's peaks barely dropped, which makes the shape less clean than the textbook version. This kind of imperfection is the rule, not the exception.
Breakout and What Came Next
On July 23 the index closed at 7,408.30, below the formation's last trough. By the rules, the top diamond was confirmed. The decline only continued until July 29, when the close was 7,316.15, 1.2% below the breakout and far from the 7,025.25 target. By August 4 the index was already closing at 7,736.52, above the pattern's top, and on August 13 it marked a high of 7,816.70. Anyone who sold the breakout with a stop above the formation's last peak (7,581.50) was stopped out on August 3, eight trading days later; anyone who sold without a stop saw the index rise 5.7% in four trading days starting from July 29.

How to Trade the Diamond Pattern
Require Both Halves and the Prior Trend
A widening alone is a broadening triangle; a narrowing alone is a symmetrical triangle. The diamond only exists with both phases, in that order, after a clear move.
Wait for the Close Outside the Formation
Since the second half's lines converge, the price touches them several times. Use the candle's close, not the day's high or low, as confirmation.
Place the Stop on the Other Side
For the top diamond, the most used reference is above the right half's last peak; in the example, above 7,581.50. A sale at 7,408.30 with that stop risked 173.20 points for a target 383.05 points away. The math looked favorable, and the trade still ended at the stop.
Confirm with Volume and Context
Higher volume on the breakout reinforces the read. Macroeconomic news, earnings season, and interest rate decisions can override any pattern on a broad index like the S&P 500.
Limitations
The diamond is rare, and drawing it is subjective: with different choices of points, the breakout and the target change. Many analysts find diamonds only after the price has already fallen, which gives a false impression that the pattern always works. Even in large samples, rare patterns have too few occurrences to know with confidence how they behave.
Common Mistakes When Trading the Diamond Pattern
- Calling any consolidation a diamond, without the widening and narrowing phases.
- Trading the pattern without a clear prior trend.
- Entering before the close outside the formation.
- Treating the target as certain and skipping the stop, as the S&P 500 showed in August.
- Redrawing the lines after the fact to make the pattern look like it worked.
- Forgetting that the example above describes what happened, not what will happen.
To practice, look for widening formations followed by narrowing ones on the daily chart of assets you follow in your demo account. Note down the points you used, the breakout, the stop, and the target, and record the result. Since the diamond is rare, every entry is worth a lot for understanding how it behaves in your market.
Practice before you risk. Open your Duotide account and test your ideas on the demo account with US$10,000 in virtual funds.
Create free accountUpdated:
Editorial character of the Duotide newsroom. Articles are written by the team with the help of artificial intelligence; prices and charts come from real market data. Explains charts, indicators and trading strategies: how they work, where they fail and how to test them first.
Was this article helpful?
Be the first to rate it.
Comments
- No comments yet. Be the first to comment.
Ready to put it into practice?
Open your account and practice on the demo account with US$10,000 in virtual funds, without risking money.
- Secure platformProtected login and identity verification
- Multilingual supportHelp available every day
- Free demo accountUS$10,000 virtual to practice
Trading involves the risk of losing the capital invested.
