

 Português pt
 Español es
 العربية ar
 বাংলা bn
 Deutsch de
 Filipino fil
 Français fr
 हिन्दी hi
 Bahasa Indonesia id
 Italiano it
 Русский ru
 Svenska sv
 ไทย th
 Türkçe tr
 Tiếng Việt vi
 简体中文 zh
Updated:
StrategiesDouble Moving Average Crossover: How to Combine Them
 Naomi TanakaEditorial character · Analysis Desk

Quick answer
A double moving average crossover uses a fast average (for example, 20 periods) and a slow one (for example, 50): when the fast one crosses above the slow one, it's a signal of a possible rally; when it crosses below, a possible decline. The combination filters out some of the noise of using a single average, but it lags and produces false signals in a sideways market. It works better as a trend filter than as a standalone trigger.
A single moving average on the chart already helps you see the price's direction, but it leaves one question unanswered: when to enter? Waiting for the price to cross the average tends to generate too many signals, because the price crosses above and below it every time it swings with no direction.
The solution most trend traders use is putting two averages on the same chart, one fast and one slow, and watching for the crossover between them. In this guide we use real daily Nvidia (NVDA) quotes between February and October 2026, with the 20- and 50-session simple moving averages, to show the calculation and the signals that actually showed up.
What a double moving average crossover is
The fast average, with a short period, tracks the price closely. The slow one, with a long period, shows the underlying direction. When the fast one crosses above the slow one, recent prices are above the average of the last several months: that's the bullish crossover. When it crosses below, it's the bearish crossover. In the 50- and 200-period combination, these crossovers earned the nicknames golden cross and death cross.
The distance between the two lines also carries information: averages spread well apart indicate a strong trend; averages stuck together indicate indecision.
Choosing the periods
There's no one right combination for everyone. The most common ones are 9 and 21 for short terms, 20 and 50 for medium term, and 50 and 200 for the long-term trend. Short averages react faster and get it wrong more often; long averages take longer to confirm and filter out more noise.

How to calculate the averages
The N-period simple moving average is the sum of the last N closes divided by N. For Nvidia, on October 7, 2026:
- Sum of the 20 closes from September 10 to October 7: US$4,511.57 → 20-day average = 4,511.57 ÷ 20 = US$225.58.
- Sum of the 50 closes from July 29 to October 7: US$11,029.16 → 50-day average = 11,029.16 ÷ 50 = US$220.58.
- The 20-day average above the 50-day one, with the price at US$237.47 above both: an uptrend setup.
With each new session, the oldest close drops out and the newest one comes in. The crossover happens on the day the order between the two averages flips.
Real example: Nvidia's 20- and 50-day averages
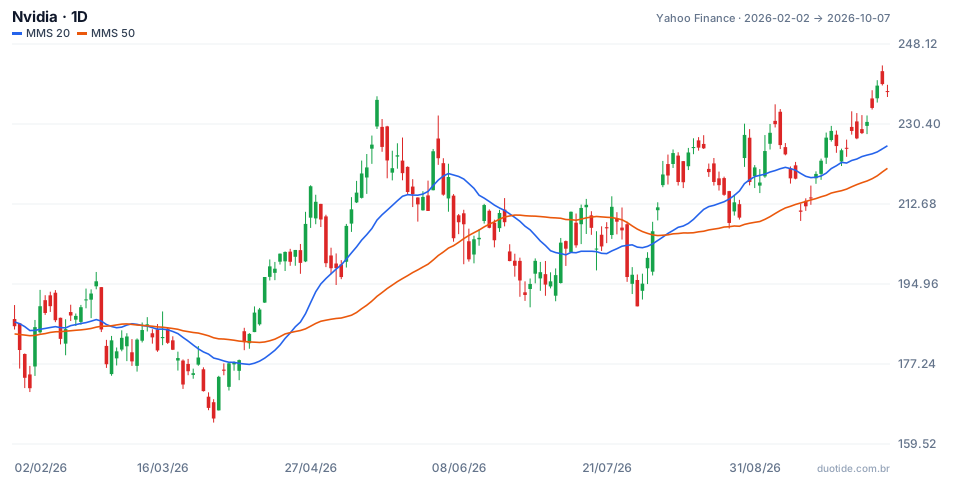
Over the period, the stock went from US$185.61 on February 2 to US$237.47 on October 7, up 27.94%, with a low of US$164.27 on March 30 and a high of US$243.37 on October 6. There were six crossovers. Imagine someone who only buys on the bullish crossover and sells on the bearish one.
March: three crossovers in seven sessions
The averages were stuck together: on March 2, the 20-day one was at US$185.55 and the 50-day one at US$185.72. That brought a bearish crossover on March 2, a bullish one on March 6 (buy at US$177.82), and another bearish one on March 10 (sell at US$184.77). That trade made +US$6.95 per share, but by luck: three signals in seven sessions is the picture of a market with no direction, and the stock still fell to US$164.27 by the end of the month.
April to June: the right signal and the late exit
The bullish crossover on April 22 came with the stock at US$202.50. The price reached US$236.54 on May 14, but the bearish crossover only showed up on June 24, with the stock at US$199.00. Result: −US$3.50 per share, or −1.73%, after having been more than US$30 in profit. That's the cost of the lag: the 50-day average is slow to turn.
August: the trend that paid off
The bullish crossover on August 6 happened with the stock at US$218.99 and the averages at US$206.17 and US$205.85. One way to structure the trade:
- Stop a bit below the 50-day average: US$205.00. Risk: 218.99 − 205.00 = US$13.99 per share.
- Maximum accepted risk: US$200 → 200 ÷ 13.99 = 14.3 → 14 shares (a risk of US$195.86).
- The next low was US$207.25, on August 24, above the stop. By October 7, with no new bearish crossover, the stock closed at US$237.47: +US$18.48 per share, or 14 × 18.48 = US$258.72, about 1.3 times the risk taken.
Together, the three cases show the strategy's typical pattern: small losses and confusing signals in sideways markets, concentrated gains in long trends. They describe what happened, not what will happen.

How to use a double moving average crossover
As a direction filter
With the fast average above the slow one, look only for buys; below it, only sells or stay out. Use another criterion, like a pullback to the fast average or a breakout, for the exact entry timing.
Require a gap between the averages
In March, the averages were separated by pennies. A simple rule, like requiring the distance between them to exceed 1% of the price, would have discarded those signals.
Use a trend-strength indicator
An ADX above 20 or 25 indicates a well-defined trend. Crossovers with a low ADX tend to be the most unreliable.
Limitations
The averages are calculated from past prices, so every signal arrives late, as in June. In a sideways market, the method generates strings of small losses, known as whipsaw. And the best combination of periods for one asset might not work for another.
Common mistakes when combining two moving averages
- Trading every crossover, even when the averages are stuck together.
- Changing the periods after every loss, chasing the perfect combination in the past.
- Waiting for the opposite crossover to exit without having a defined stop.
- Ignoring position size: the technical stop changes with every trade, and the number of shares needs to follow it.
- Concluding that one period's result holds forever.
To practice, put the 20- and 50-day averages on the daily chart of an asset on a demo account and log every crossover: date, price, distance between the averages, and what happened until the next crossover. After a few months you'll know whether the method fits the asset and your patience.
Practice before you risk. Open your Duotide account and test your ideas on the demo account with US$10,000 in virtual funds.
Create free accountUpdated:
Editorial character of the Duotide newsroom. Articles are written by the team with the help of artificial intelligence; prices and charts come from real market data. Explains charts, indicators and trading strategies: how they work, where they fail and how to test them first.
Was this article helpful?
Be the first to rate it.
Comments
- No comments yet. Be the first to comment.
Ready to put it into practice?
Open your account and practice on the demo account with US$10,000 in virtual funds, without risking money.
- Secure platformProtected login and identity verification
- Multilingual supportHelp available every day
- Free demo accountUS$10,000 virtual to practice
Trading involves the risk of losing the capital invested.
