

 Português pt
 Español es
 العربية ar
 বাংলা bn
 Deutsch de
 Filipino fil
 Français fr
 हिन्दी hi
 Bahasa Indonesia id
 Italiano it
 Русский ru
 Svenska sv
 ไทย th
 Türkçe tr
 Tiếng Việt vi
 简体中文 zh
Updated:
StocksEli Lilly (LLY) stock in 2026: analysis, chart, and price drivers
 Rafael AzevedoEditorial character · Markets Desk

Quick answer
Eli Lilly (LLY) stock is driven mainly by demand for the GLP-1 drugs Mounjaro and Zepbound, by the pipeline, and by the debate over drug pricing. In 2026 the stock fell as much as 20.8% for the year in April, rose 50.4% through August, and closed on October 7 up 10.6%. With a P/E above 40 in June, the stock already priced in a lot of growth and reacted sharply to surprises.
Few pharmaceutical companies drew as much market attention in 2026 as Eli Lilly. GLP-1 class drugs, used for diabetes and obesity, changed the way investors see the size of this market. At the same time, they raised the question of how long the pace of growth can hold up.
This article organizes the factors that move the stock (ticker LLY, on the New York Stock Exchange), the numbers released in June 2026, and what the actual daily chart showed from January to October. The business data reflects that moment and may have already changed. Nothing here is a recommendation to buy or sell.
What Eli Lilly does
Eli Lilly develops and sells prescription drugs. The model follows the industry standard: invest heavily in research, obtain regulatory approval, and scale distribution through doctors, hospitals, and pharmacies.
The current engine is tirzepatide, sold as Mounjaro for diabetes and Zepbound for obesity. The company has been investing tens of billions of dollars to expand manufacturing capacity and is developing oral options, such as the orforglipron pill. It also sells drugs in oncology, Alzheimer's, and immunology, which reduces dependence on a single product.

The numbers released in June 2026
- Revenue growing 44.7% year over year.
- Projected annual revenue of about $65.2 billion.
- Trailing-12-month earnings per share (EPS) of $28.20.
- Expanded health plan and public program coverage for obesity treatments, with manufacturing expansion planned through 2028.
How to calculate the P/E with real prices
The price/earnings ratio (P/E) is the stock price divided by earnings per share. It tells you how many years of current earnings the market is paying for. With the EPS of $28.20 cited in June:
- Close on June 30, 2026: $1,199.43 ÷ 28.20 = P/E of 42.5.
- Close on April 29, 2026, the year's lowest: $851.21 ÷ 28.20 = P/E of 30.2.
With the same earnings, the multiple the market paid varied by more than 12 points in two months. A P/E above 40 means the price already prices in a lot of future growth, and stocks like that tend to react sharply to any surprise, positive or negative.
Real example: LLY stock and the 50- and 200-day averages
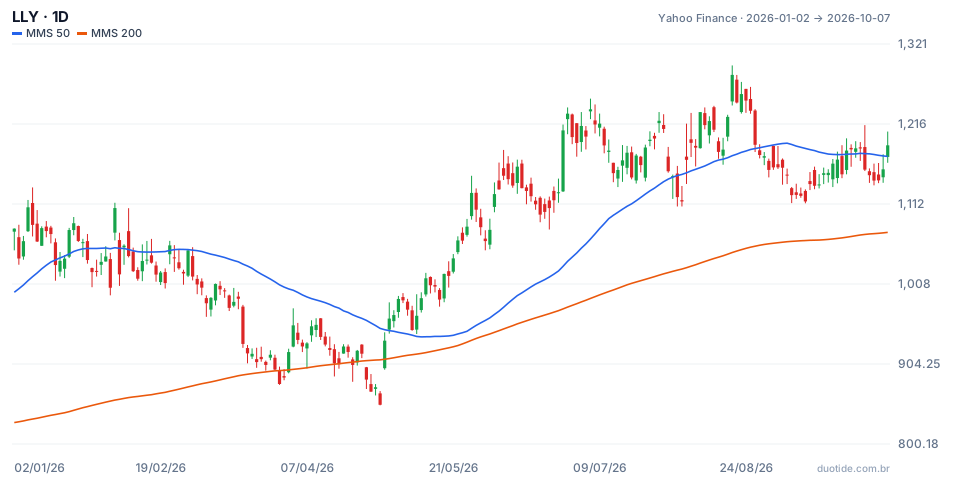
The chart shows LLY's daily candles (Yahoo Finance) with the 50-day (blue) and 200-day (orange) simple moving averages. The stock closed 2025 at $1,074.68 and, on October 7, 2026, stood at $1,188.72, up 10.6% for the year. Three moments explain the path.
February: two-day volatility
On February 4 the stock rose 10.3%, from $1,003.46 to $1,107.12. The next day it gave back 7.8% and closed at $1,020.84. Even a large-cap company can swing almost 20% in two trading sessions when the market reprices expectations.
March and April: price below the 200-day average
On March 27, LLY closed at $878.24, below the 200-day average for the first time that year. Between March 27 and April 30, the price crossed that average eight times, both up and down, and made the year's lowest close on April 29, $851.21, 20.8% below the end of 2025. The next day, April 30, it rose 9.8% and moved back above the 200-day average, where it stayed through the end of the period. The 50-day average came close to the 200-day in May but did not cross below it.
May to August: the rebound
From the April low to the closing high on August 19, $1,280.34, the stock rose 50.4%. After that it went back to oscillating around the 50-day average, crossing it several times between late August and early October, and closed on October 7 down 7.2% from the August high.

How to analyze Eli Lilly stock
Prescriptions and treatment adherence
The volume of Mounjaro and Zepbound prescriptions and patient adherence to treatment are the data points that best explain revenue. Track these numbers with every quarterly report.
Payers and regulation
Debates over drug pricing and insurance coverage determine how much health plans and governments are willing to pay for obesity treatments at scale. Changes in this area directly affect revenue projections.
Pipeline and interest rates
Approvals in oncology, Alzheimer's, and new oral versions could open new growth fronts. Higher interest rates, on the other hand, tend to weigh on stocks with elevated multiples, because they reduce the present value of future earnings.
Limitations
The P/E calculated above uses June's earnings, which change every quarter. Moving averages show past trends and generate several false crossovers in sideways phases, as in April and September. And regulatory or clinical trial news can move the price in a single day more than months of trend.
Common mistakes when analyzing Eli Lilly stock
- Assuming high revenue growth guarantees a higher stock price: in 2026 revenue grew more than 40% and the stock still fell as much as 20.8% for the year.
- Looking at the P/E without remembering that it changes with both price and each quarter's earnings.
- Relying on a single product in the analysis and ignoring the rest of the portfolio and pipeline.
- Ignoring regulatory risk and drug pricing risk.
- Trading every crossover of price with the 200-day average during an indecisive phase, as in April.
- Reading the 2026 chart as a forecast: it shows what happened, not what will happen.
To study the stock without risking money, open LLY's daily chart on a demo account, add the 50- and 200-day averages, recalculate the P/E with every quarterly report, and record how the price reacted to each release. That record shows, with your own data, how the market prices the company's growth.
Practice before you risk. Open your Duotide account and test your ideas on the demo account with US$10,000 in virtual funds.
Create free accountUpdated:
Editorial character of the Duotide newsroom. Articles are written by the team with the help of artificial intelligence; prices and charts come from real market data. Follows the news that moves prices — rates, stock markets, companies and commodities — explained without jargon.
Was this article helpful?
Be the first to rate it.
Comments
- No comments yet. Be the first to comment.
Ready to put it into practice?
Open your account and practice on the demo account with US$10,000 in virtual funds, without risking money.
- Secure platformProtected login and identity verification
- Multilingual supportHelp available every day
- Free demo accountUS$10,000 virtual to practice
Trading involves the risk of losing the capital invested.
