

 Português pt
 Español es
 العربية ar
 বাংলা bn
 Deutsch de
 Filipino fil
 Français fr
 हिन्दी hi
 Bahasa Indonesia id
 Italiano it
 Русский ru
 Svenska sv
 ไทย th
 Türkçe tr
 Tiếng Việt vi
 简体中文 zh
Updated:
StrategiesFutures Trading Strategies: Which One to Use in Each Market
 Naomi TanakaEditorial character · Analysis Desk
Quick answer
There's no futures strategy that always works: following the trend and entering on pullbacks work in a directional market, range trading works in a sideways market, and breakouts work after compression with volume. For beginners, a pullback entry with a small position is the most instructive. Before any entry, convert the stop into money using the contract's point value.
A good futures strategy has less to do with finding a brilliant entry signal and more to do with knowing when it should be ignored. Trend following shines in a directional market and struggles in a sideways one. Breakouts work when volume confirms them and fail when price just touches the level and comes back. No technique works the same way in every scenario.
In this guide we use real daily quotes for the gold futures contract (GC=F, Yahoo Finance) between April and October 2026 to show a pullback entry, the ATR-based stop calculation, and how much that costs in dollars per contract.
What futures contracts are
Futures contracts are standardized, exchange-traded agreements to buy or sell an asset on a future date at a price set today. Each contract has its own specification: size, point value, expiration, and required margin. In COMEX gold, the standard contract (GC) equals 100 troy ounces, so each $1 move is worth $100; the micro (MGC) has 10 ounces, and each $1 is worth $10. On B3, the mini index contract is worth R$0.20 per point.
Futures are different from CFDs, even when they track the same markets. They involve leverage, daily settlement, and can generate losses larger than the deposited margin.

First step: identify the type of market
- Strong trend: following the trend and entering on pullbacks tends to work; betting on a reversal tends to struggle.
- Compression before a move: a breakout with volume fits better; entering before confirmation is the most common mistake.
- Sideways market: trade the range, buying near the floor and selling near the ceiling; following the trend with a tight stop generates repeated losses.
- Scheduled news: reacting after the data makes more sense than trying to guess the direction beforehand.
Seven approaches worth knowing
Trend following: entering in the dominant direction and staying with it while it lasts, using moving averages or recent highs and lows. Pullback entry: waiting for a pause within the trend to enter with a closer stop; it's the most sensible entry point for beginners. Breakout: entering when price exits a compression with volume. Range trading: buying at the floor and selling at the ceiling of a sideways market. Spread between contracts: trading the difference between expirations or related assets, reducing directional exposure. News trading: reacting to the move after economic data, with slippage risk. Order flow: reading the order book and real-time aggressive orders, an advanced, very short-term approach.

Real example: a pullback entry in gold in August 2026
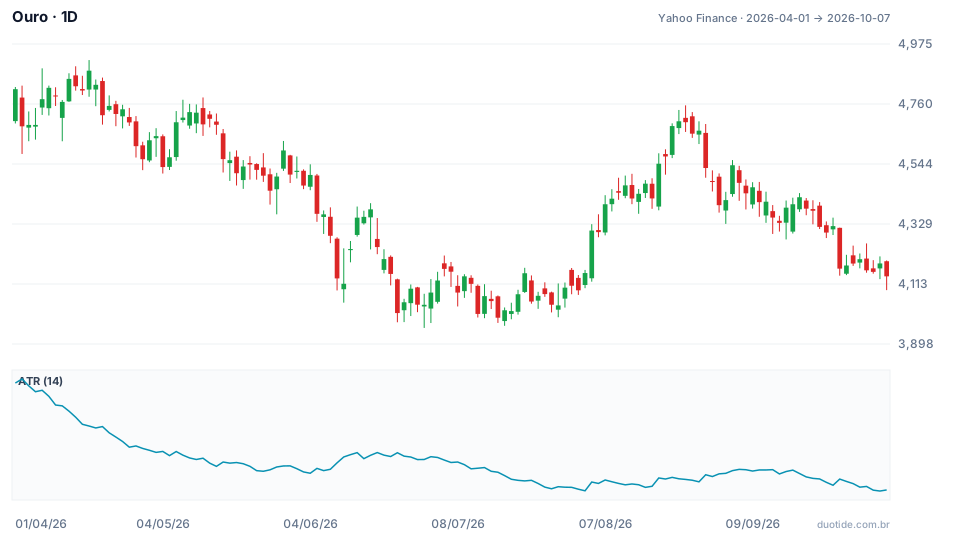
The chart shows gold from April 1, 2026 ($4,813.10) to October 7, 2026 ($4,140.70), with the 14-period ATR, which measures the average daily range. The period's high was $4,917.70 on April 17, and the low, $3,955.40 on June 30.
The trend and the pullback
From July 28 ($4,038.70) to August 12 ($4,467.50) gold rose 10.6%. Between August 13 and August 18 it paused and pulled back to a low of $4,365.50, on August 14. On August 19 it resumed the rally and closed at $4,545.30, with the ATR at $104.50.
Calculating the risk
- Entry: $4,545.30. Stop below the pullback's low: $4,360.00
- Distance: 4,545.30 − 4,360.00 = $185.30, about 1.8 ATR
- Risk per micro contract (MGC): 185.30 × $10 = $1,853
- Risk per standard contract (GC): 185.30 × $100 = $18,530
This is where a lot of people discover the trade doesn't fit their account. To risk at most 1% per trade with a single micro contract, the account would need about $185,300. With a smaller account, the right decision is not to trade that asset at that size, not to tighten the stop until it fits.
What happened next
Gold reached $4,755.00 on August 25, $209.70 above the entry, about 1.1 times the risk. It didn't reach a 2-to-1 target ($4,915.90). On September 2 the low was $4,329.20 and the stop was hit. Anyone who had closed half the position at 1-to-1 ($4,730.60, reached on August 24, with a high of $4,738.50) would have offset part of the loss. After that the market changed: from September 3 ($4,539.90) to October 7 gold fell 8.8%, and buying pullbacks stopped making sense.
How to use futures strategies
Convert points into money first
The number in points only means something once it's multiplied by the point value and compared with the account size.
Use the ATR to size positions
Gold's ATR went from $196.48 on April 2 to $92.41 on October 6. The same 1.5 ATR stop was worth twice as much in dollars back in April. Adjust position size when volatility changes.
Watch the expiration
Contracts expire. Near expiration, liquidity migrates to the next one, and anyone who wants to keep the position needs to roll it, at a cost.
Limitations
Opening gaps can jump past the stop. The exchange can raise margin on volatile days. And one successful or unsuccessful example says nothing about the next one.
Common mistakes in futures trading
- Thinking in points and forgetting how much each point is worth in money.
- Tightening the stop to fit the account, instead of reducing size or not trading.
- Using the same strategy in a trend and in a sideways market.
- Ignoring the expiration date and the roll.
- Starting with news, spreads, or order flow before mastering the basics.
- Treating the examples above as a forecast: they describe what happened with gold.
To practice without risking money, pick an asset on a demo account, classify the type of market every week, and log each entry with stop, target, risk in money, and result. That record quickly shows which approach fits your pace and your account size.
Practice before you risk. Open your Duotide account and test your ideas on the demo account with US$10,000 in virtual funds.
Create free accountUpdated:
Editorial character of the Duotide newsroom. Articles are written by the team with the help of artificial intelligence; prices and charts come from real market data. Explains charts, indicators and trading strategies: how they work, where they fail and how to test them first.
Was this article helpful?
Be the first to rate it.
Comments
- No comments yet. Be the first to comment.
Ready to put it into practice?
Open your account and practice on the demo account with US$10,000 in virtual funds, without risking money.
- Secure platformProtected login and identity verification
- Multilingual supportHelp available every day
- Free demo accountUS$10,000 virtual to practice
Trading involves the risk of losing the capital invested.
