

 Português pt
 Español es
 العربية ar
 বাংলা bn
 Deutsch de
 Filipino fil
 Français fr
 हिन्दी hi
 Bahasa Indonesia id
 Italiano it
 Русский ru
 Svenska sv
 ไทย th
 Türkçe tr
 Tiếng Việt vi
 简体中文 zh
Updated:
CommoditiesGold vs. Bitcoin: Which to Trade? Volatility, Risk, and Differences
 Rafael AzevedoEditorial character · Markets Desk

Quick answer
There's no single best choice: gold and bitcoin are different assets and require different position sizes. Between April and October 2026, bitcoin averaged 1.40% daily swings against gold's 1.10%, dropped as much as 28.7% from its peak against the metal's 18.2%, and trades 24 hours a day, seven days a week. The choice depends on how much volatility you can tolerate and the hours you can actually watch the market, and each trade's size should be based on the asset's real volatility.
Gold and bitcoin are constantly compared: one is the metal central banks have held for centuries, the other earned the nickname digital gold. For traders, the comparison that matters is more practical: how much each one moves, how far it can fall, when it trades, and how that changes position size.
This text doesn't recommend buying or selling either one. We used real daily quotes for gold (GC=F futures contract, Yahoo Finance data) and bitcoin (BTC/USDT on Binance) between April 1, 2026 and October 7, 2026 to measure the differences, instead of repeating impressions.
What Sets Gold and Bitcoin Apart
What Supports the Price
- Gold: has jewelry demand, industrial use, and is held as a reserve by central banks. Supply grows slowly, limited by mining.
- Bitcoin: has a maximum supply fixed by the network's rules and no industrial use. The price depends on adoption, investor flows, regulation, and expectations.
Trading Hours
Gold trades almost 24 hours on weekdays, with liquidity concentrated around the London and New York opens, and it stops on weekends. Bitcoin never stops: over the same period analyzed, there were 131 gold trading days and 190 bitcoin days. News on a Saturday moves bitcoin right away and only reaches gold on Monday, sometimes with a gap at the open.
Behavior During Periods of Stress
Gold is usually sought as protection during risk-averse periods. Bitcoin, in many recent periods, has moved more closely with risk assets, such as tech stocks. That relationship changes over time; it's not a fixed rule.

Real Example: Gold and Bitcoin Between April and October 2026
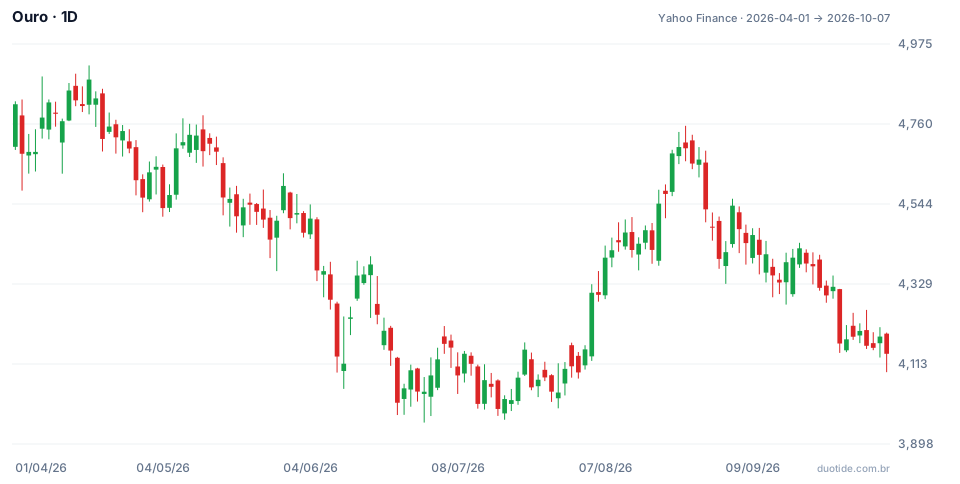
The chart shows gold, which went from $4,813.10 on April 1, 2026 to $4,140.70 on October 7, 2026, a 14.0% drop, with a high of $4,917.70 on April 17 and a low of $3,955.40 on June 30. Over the same span, bitcoin went from $68,113.92 to $83,321.81, a 22.3% gain. We calculated the same measures for both:
- Average daily move, in absolute value: gold 1.10%; bitcoin 1.40%.
- Standard deviation of daily returns: gold 1.43%; bitcoin 1.98%.
- Days with a move above 2%: gold 21 of 130; bitcoin 43 of 189.
- Biggest one-day gain: gold +3.7% (August 5, from $4,152.60 to $4,305.20); bitcoin +7.3% (August 21, from $73,025.15 to $78,338.03).
- Biggest peak-to-trough drop (closes): gold −18.2%, from $4,879.60 on April 17 to $3,992.10 on July 16; bitcoin −28.7%, from $82,210.07 on May 10 to $58,624.71 on June 30.
- Correlation of daily returns (only on days when both traded): 0.45. The two moved in the same direction often, but far from being the same asset.
What the Numbers Show
First, bitcoin was more volatile, as expected, but the gap over the period was smaller than its reputation suggests: 1.40% against gold's 1.10% average daily move. Second, gold, seen as a safe haven, fell 18.2% in three months and then rose 17.7% to $4,697.80 on August 24, before pulling back again. Third, anyone holding bitcoin at the June 30 bottom saw the price rise 33.6% through August 21. Neither one was stable, and none of these moves was predictable beforehand.
How to Adjust Position Size for Each One
Using the same dollar amount on both assets means taking on different risks. The simplest way to balance that is to start from the ATR (average range over the last 14 days) and how much you're willing to lose per trade.
On October 7, 2026, the 14-day ATR was $93.43 for gold (2.26% of the price) and $2,187.23 for bitcoin (2.63% of the price). Suppose a $10,000.00 account, 1% risk per trade ($100.00), and a stop at 1.5 ATR from the entry:
- Gold: stop = 1.5 × 93.43 = $140.15 per ounce. Size = 100.00 ÷ 140.15 = 0.7135 ounces, about $2,954.58 at $4,140.70 per ounce.
- Bitcoin: stop = 1.5 × 2,187.23 = $3,280.85 per BTC. Size = 100.00 ÷ 3,280.85 = 0.03048 BTC, about $2,539.64 at $83,321.81.
With the same dollar risk, the bitcoin position ended up about 14% smaller than the gold one. In more volatile bitcoin phases, the gap grows a lot. The calculation has to be redone with the day's ATR, not a memorized number.

How to Choose Between Gold and Bitcoin
By the Hours You Can Actually Watch
If you only watch the market during business hours, gold has predictable pauses. With bitcoin, a position opened on Friday can go through two days of movement without you watching. Setting a stop before stepping away from the screen is mandatory for both, and even more so for bitcoin.
By the Swings You Can Tolerate
A 28.7% drop in seven weeks, like bitcoin's between May and June, tests any plan. If watching that happen would make you abandon your rules, the position size needs to be smaller, or the asset doesn't fit you right now.
By What Moves Each Price
For gold, US interest rates, the dollar, and central bank purchases carry weight. For bitcoin, fund flows, regulatory news, and the mood of risk assets. Trading an asset whose news you don't follow increases the surprises.
Limitations of the Comparison
Six months is a short sample. In other periods, bitcoin's volatility has been double or triple gold's, and the correlation between the two has been negative before. Redo the math with recent data before drawing conclusions.
Common Mistakes When Comparing Gold and Bitcoin
- Using the same position size for both assets, without considering each one's volatility.
- Treating gold as an asset that doesn't fall: in the period analyzed it lost 18.2% from peak to trough.
- Treating bitcoin as automatic crisis protection, when it frequently moves with risk assets.
- Leaving a bitcoin position open over the weekend without a stop.
- Choosing the asset based on the last few months' performance, as if it would repeat. The numbers above describe what happened, not what will happen.
To practice, open both charts in your demo account, calculate each one's ATR, and simulate trades with the same dollar risk over a few weeks. Note down the result and, above all, how you reacted to each asset's swings: that answers better than any comparison which of the two fits you.
Practice before you risk. Open your Duotide account and test your ideas on the demo account with US$10,000 in virtual funds.
Create free accountUpdated:
Editorial character of the Duotide newsroom. Articles are written by the team with the help of artificial intelligence; prices and charts come from real market data. Follows the news that moves prices — rates, stock markets, companies and commodities — explained without jargon.
Was this article helpful?
Be the first to rate it.
Comments
- No comments yet. Be the first to comment.
Ready to put it into practice?
Open your account and practice on the demo account with US$10,000 in virtual funds, without risking money.
- Secure platformProtected login and identity verification
- Multilingual supportHelp available every day
- Free demo accountUS$10,000 virtual to practice
Trading involves the risk of losing the capital invested.
