

 Português pt
 Español es
 العربية ar
 বাংলা bn
 Deutsch de
 Filipino fil
 Français fr
 हिन्दी hi
 Bahasa Indonesia id
 Italiano it
 Русский ru
 Svenska sv
 ไทย th
 Türkçe tr
 Tiếng Việt vi
 简体中文 zh
Updated:
CommoditiesHow to Trade Commodities: A Complete Guide for Beginners
 Rafael AzevedoEditorial character · Markets Desk
Quick answer
To trade commodities, pick a family (energy, metals, or agricultural), understand what moves its supply and demand, and follow the reports calendar. Then adjust the position size to the volatility: in 2026 oil swung about 4.2% per day, almost three times corn. Use a stop defined before the entry and extra caution with leverage.
Oil, gold, coffee, corn, natural gas: commodities are basic goods, produced at large scale and traded with little difference from one batch to another. Unlike a stock, whose price reflects a company's health, a commodity's price mainly reflects the balance between supply and demand for a physical product used around the world.
In this guide we use real daily quotes from futures contracts traded in the United States, from March to October 2026, to show something that tends to surprise beginners: each commodity has its own rhythm, and some move several times more than others.
What commodities are and how they're grouped
- Energy: oil, natural gas, and derivatives. Sensitive to decisions by producing countries, inventories, conflicts, and industrial demand.
- Precious metals: gold and silver, used as a store of value and, in silver's case, also in industry.
- Industrial metals: copper, aluminum, and others, tied to construction and industry.
- Agricultural: soybeans, corn, wheat, coffee, and sugar, heavily influenced by harvests and weather.

What moves a commodity's price
Weather and harvests weigh heavily on agricultural commodities: a drought in a coffee-producing region can reduce expected supply and push the price up, even with no change in demand. Production decisions by major oil exporters directly affect energy supply. Inventories released weekly, like US oil stocks, also tend to trigger moves on the day they're published.
Currency comes into play in almost all of them: most commodities are priced in dollars, so a stronger or weaker dollar changes the product's relative cost for buyers using other currencies. And global economic activity affects demand for energy and industrial metals.
How to measure the volatility of each commodity
A simple way to compare risk is to calculate the typical daily move: the standard deviation of one-day returns. Between March 2 and October 7, 2026, the futures contracts had:
- WTI oil: 4.24% per day. It went from US$71.23 to US$88.28 per barrel (+23.9%).
- Silver: 2.95% per day. It fell from US$88.28 to US$59.90 per ounce (−32.2%).
- Arabica coffee: 2.80% per day. It rose from 288.35 to 304.45 cents per pound through October 6 (+5.6%).
- Gold: 1.64% per day. It pulled back from US$5,311.60 to US$4,140.70 (−22.0%).
- Corn: 1.47% per day. It rose from 433.25 to 502.00 cents per bushel (+15.9%).
Oil swung almost three times as much as corn over the same period. Treating the two as if they carried the same risk is the first mistake beginners make.

Real example: oil in 2026
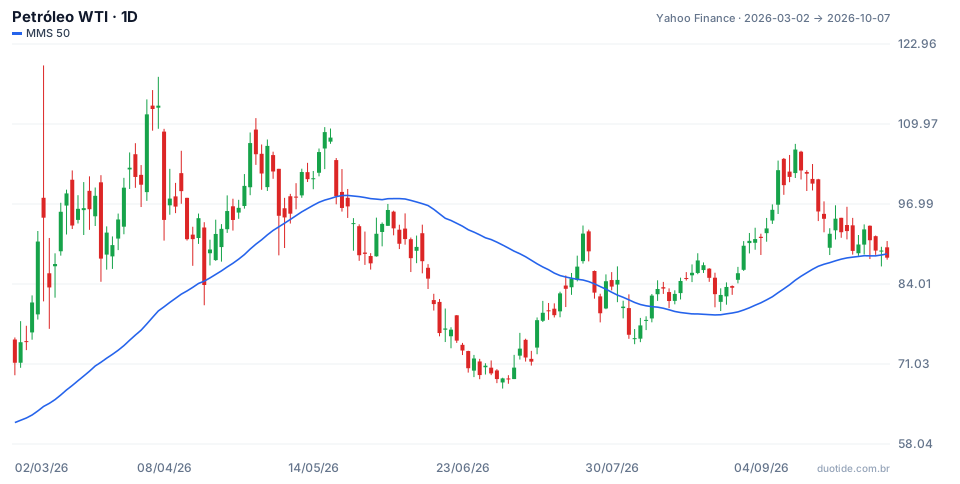
The chart shows WTI oil with the 50-session simple moving average. Three moments show how a commodity can move:
March: from US$67 to US$119 in six sessions
The barrel closed February 27 at US$67.02 and, on March 6, at US$90.90, after rising 12.2% in that single day. On March 9 the day's high reached US$119.48, but the close was US$94.77: a range of more than US$38 in a single session. In moves like that, tight stops get triggered by simple noise.
April: the 16% drop in a day
Oil closed April 7 at US$112.95 and, on April 8, at US$94.41, down 16.4%. Anyone long with high leverage may have lost in a single day what they had gained over weeks.
June and July: back to where it started
After closing above US$90 on 51 of the 63 sessions from March to May, the barrel pulled back to a low of US$67.04 on July 2, close to the level before the rally. It rose again and closed September 15 at US$105.83. On October 7 it was at US$88.28, back below the 50-session average (US$88.90). These are past facts, and they say nothing about the next move.
How to trade commodities
Pick a family and study its calendar
Start with one commodity and learn what moves it: for oil, producing-country meetings and weekly inventories; for grains, harvest reports; for precious metals, US interest rates and the dollar. Mark these dates on your calendar before trading.
Size the position by volatility
With the numbers above, to risk US$100 with a stop of two typical daily moves:
- Oil: stop of 2 × 4.24% = 8.48%. Position = 100 ÷ 0.0848 = about US$1,180.
- Corn: stop of 2 × 1.47% = 2.94%. Position = 100 ÷ 0.0294 = about US$3,400.
The money risk is the same; the oil position is almost three times smaller.
Understand the instrument
Commodities can be traded through futures contracts, funds that track the price, stocks of companies in the sector, and contracts for difference. Futures expire and need to be rolled; contracts for difference charge financing by the night. Both use leverage.
Limitations
One period's volatility doesn't necessarily repeat in the next: oil in 2026 was far more turbulent than usual. Recalculate the measure periodically. Supply shocks can also produce price gaps that jump right over any stop.
Common mistakes when trading commodities
- Using the same position size in oil, gold, and corn.
- Trading on an inventory or harvest report day without knowing it exists.
- Ignoring the contract's expiration and rollover cost.
- Trying to guess the top after a strong rally: on March 3 the barrel had already risen from US$67.02 to US$74.56, and the high of US$119.48 only came four sessions later.
- Concentrating the account in a single commodity just because you think you understand the sector.
To practice without risking money, pick a commodity on a demo account, calculate its typical daily move, and use that number to set the stop and size. Log your trades for a few weeks and compare the risk you planned with what actually happened.
Practice before you risk. Open your Duotide account and test your ideas on the demo account with US$10,000 in virtual funds.
Create free accountUpdated:
Editorial character of the Duotide newsroom. Articles are written by the team with the help of artificial intelligence; prices and charts come from real market data. Follows the news that moves prices — rates, stock markets, companies and commodities — explained without jargon.
Was this article helpful?
Be the first to rate it.
Comments
- No comments yet. Be the first to comment.
Ready to put it into practice?
Open your account and practice on the demo account with US$10,000 in virtual funds, without risking money.
- Secure platformProtected login and identity verification
- Multilingual supportHelp available every day
- Free demo accountUS$10,000 virtual to practice
Trading involves the risk of losing the capital invested.
