

 Português pt
 Español es
 العربية ar
 বাংলা bn
 Deutsch de
 Filipino fil
 Français fr
 हिन्दी hi
 Bahasa Indonesia id
 Italiano it
 Русский ru
 Svenska sv
 ไทย th
 Türkçe tr
 Tiếng Việt vi
 简体中文 zh
Updated:
CommoditiesHow to Trade Gold and Silver: What Moves the Price
 Rafael AzevedoEditorial character · Markets Desk

Quick answer
To trade gold and silver, first understand what moves each one: gold reacts mainly to the dollar, US real interest rates, and the flight to safety; silver reacts to that too, and also to industrial activity. In 2026 silver swung almost twice as much as gold per day, so its position should be smaller for the same risk. Set the stop and size before entering, and follow the US interest rate calendar.
Gold and silver are among the oldest assets humanity has traded, and they still have a place in modern portfolios for a practical reason: they react to different factors than the ones that move stocks and currencies. That makes them useful for diversifying and also for trading short-term moves, as long as each metal's own behavior is respected.
In this guide, instead of made-up examples, we use the real daily quotes of gold futures (GC=F) and silver futures (SI=F) traded on the US exchange, from April to October 2026, to show what these metals actually did and how to measure the risk of each one.
What moves the price of gold
The market treats gold mainly as a store of value, not as an industrial raw material. That's why its price reacts above all to three factors:
- The US dollar: gold is priced in dollars; a weaker dollar tends to make it more expensive, and a strong dollar usually weighs on it.
- Real interest rates in the United States: gold doesn't pay income. When inflation-adjusted interest rates rise, the opportunity cost of holding it increases.
- Flight to safety: in moments of political or economic instability, some investors move into assets considered safer.
What moves the price of silver
Silver shares part of the store-of-value narrative, but more than half of its demand comes from industrial use, mainly in electronics and solar panels. That's why it also reacts to industrial activity and manufacturing data. The silver market is much smaller than the gold market, which makes its moves sharper in both directions.
The numbers confirm it. Between April 1 and October 7, 2026, the typical daily move (standard deviation of daily returns) was 1.43% for gold and 2.78% for silver, nearly double. Over the same period gold fell 13.97% (from US$4,813.10 to US$4,140.70 per ounce) and silver fell 21.05% (from US$75.87 to US$59.90).
How to calculate the gold/silver ratio
The gold/silver ratio shows how many ounces of silver it takes to buy one ounce of gold. The math is simple: gold price ÷ silver price.
- April 1, 2026: US$4,813.10 ÷ US$75.87 = 63.4
- May 13, 2026, the day silver closed at its high for the period (US$88.89): US$4,706.70 ÷ US$88.89 = 53.0, the lowest ratio in the window
- July 17, 2026, the day silver closed at its low (US$56.04): US$4,018.80 ÷ US$56.04 = 71.7, the highest ratio
- October 7, 2026: US$4,140.70 ÷ US$59.90 = 69.1
A rising ratio means silver is losing ground to gold; a falling ratio means silver is gaining. In 2026 the ratio went from 53 to nearly 72 in two months, which shows how silver amplifies the metals' movement. Some traders use the ratio to decide which of the two to buy, but it doesn't have a fixed fair value: it can stay away from its historical average for months.

Real example: gold in 2026
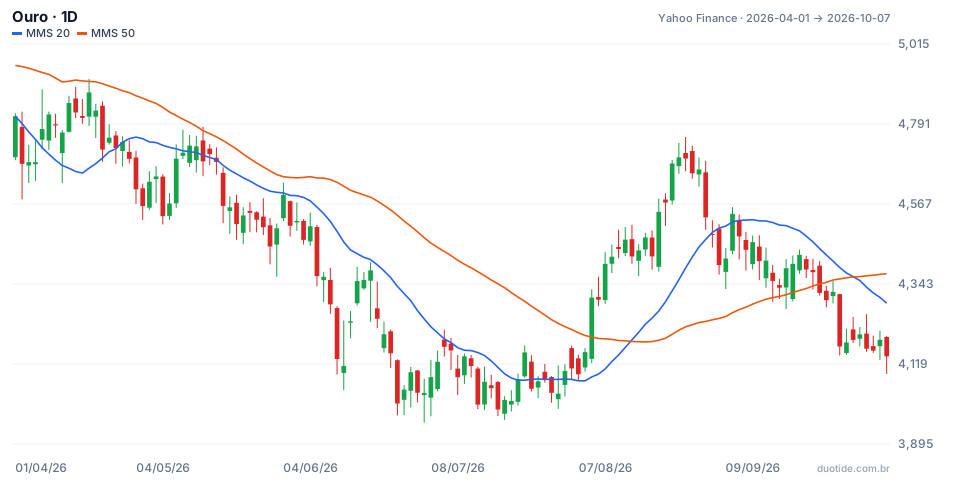
The chart shows gold with the 20-session (blue) and 50-session (orange) simple moving averages. Three moments help explain how the metal behaved:
April to June: the decline after the top
Gold hit the period's high on April 17, 2026, at US$4,917.70, and between April 20 and June 30 it closed all 50 sessions below the 50-session average and 42 of them below the 20-session average. The low came on June 30, at US$3,955.40, a decline of about 20% from the top. Anyone who treated gold as an asset that only goes up learned an expensive lesson in that stretch.
August: the 20-average turns
On August 13 the 20-session average crossed above the 50-session average, with gold at US$4,420.40. The metal kept rising and closed August 27 at US$4,664.00, after touching US$4,755.00 on August 25. The recovery, though, never gave back the April top.
May: the day silver fell 9%
On May 15 silver closed at US$77.16, against US$84.91 the day before: a drop of 9.1% in a single session. Gold fell 2.6% on the same day. A silver position sized as if it were gold would have lost more than three times as much.
On October 1 the 20-session average crossed back below the 50-session average, with gold at US$4,202.30. These are past facts: they describe what happened, not what will happen.
How to trade gold and silver
Choose the instrument
You can get exposure to the metals through futures contracts, index funds that track the price, mining stocks, and contracts for difference. Each one has its own cost, leverage, and trading hours. Mining stocks, for example, rise and fall with the metal, but also with the company's own costs.
Size the position by volatility
Since silver swings nearly twice as much as gold, the same amount invested in both doesn't carry the same risk. An example with the real numbers above, for a US$10,000 account that risks 1% (US$100) per trade and uses a stop of two typical daily moves:
- Gold: stop of 2 × 1.43% = 2.86%. Position = US$100 ÷ 0.0286 = about US$3,500
- Silver: stop of 2 × 2.78% = 5.56%. Position = US$100 ÷ 0.0556 = about US$1,800
The silver position ends up at almost half the size, and the money risk is the same in both cases.
Follow the calendar
US central bank interest rate decisions, inflation data, and employment data tend to move the metals on the same day. For silver, it's also worth watching industrial activity indicators from China and the United States.
Limitations
Correlations change. Gold doesn't always rise when stocks fall, and its relationship with the dollar weakens in certain periods. Futures contracts also have an expiration and a price difference between one contract and the next, which affects anyone holding a position for months.
Common mistakes when trading gold and silver
- Treating gold as a safe haven that never falls: in 2026 it dropped about 20% from top to bottom.
- Using the same position size in gold and silver, ignoring that silver swings nearly twice as much.
- Trading the gold/silver ratio as if it had to return to a fixed number.
- Ignoring the US interest rate and inflation calendar.
- Forgetting rollover and financing costs on leveraged positions held for weeks.
To practice without risking money, follow gold and silver side by side on a demo account, calculate the ratio once a week, and write down the position size you would use for each metal. After a few weeks, compare the logged results with what you expected.
Practice before you risk. Open your Duotide account and test your ideas on the demo account with US$10,000 in virtual funds.
Create free accountUpdated:
Editorial character of the Duotide newsroom. Articles are written by the team with the help of artificial intelligence; prices and charts come from real market data. Follows the news that moves prices — rates, stock markets, companies and commodities — explained without jargon.
Was this article helpful?
Be the first to rate it.
Comments
- No comments yet. Be the first to comment.
Ready to put it into practice?
Open your account and practice on the demo account with US$10,000 in virtual funds, without risking money.
- Secure platformProtected login and identity verification
- Multilingual supportHelp available every day
- Free demo accountUS$10,000 virtual to practice
Trading involves the risk of losing the capital invested.
