

 Português pt
 Español es
 العربية ar
 বাংলা bn
 Deutsch de
 Filipino fil
 Français fr
 हिन्दी hi
 Bahasa Indonesia id
 Italiano it
 Русский ru
 Svenska sv
 ไทย th
 Türkçe tr
 Tiếng Việt vi
 简体中文 zh
Updated:
CommoditiesBrent vs. WTI Oil: Differences, the Spread, and How to Track Them
 Rafael AzevedoEditorial character · Markets Desk

Quick answer
Brent is the North Sea oil benchmark, used in most contracts worldwide; WTI is the American oil benchmark, delivered in Cushing, Oklahoma. Both are light, sweet crudes and move in the same direction almost all the time, but the difference between them, the spread, varies with regional factors: between April and October 2026, it ranged from $3.68 in WTI's favor to $13.21 in Brent's favor.
When the news talks about the price of oil, one of two abbreviations almost always shows up: Brent or WTI. For anyone just starting out, it might seem like there's a single oil price in the world, but there are several benchmarks, each tied to a type of crude and a region.
Understanding the difference helps explain why quotes vary depending on the source and why some events affect one price more than the other. In this guide we use real daily Brent and WTI futures contract quotes from Yahoo Finance between April 1, 2026 and October 7, 2026.
What Sets One Crude Apart from Another
Crude oil isn't a standardized product. It varies depending on the extraction region, mainly in two aspects:
- Sulfur content: crude with less than 0.5% sulfur is usually called sweet; above that, sour. The sweeter it is, the easier and cheaper it is to refine.
- Density: measured in API degrees, the American Petroleum Institute's scale. The higher the degree, the lighter the oil, and the more gasoline and diesel it yields with less processing.
The most valued combination is light, sweet crude, and that's the profile of the two main benchmarks.

What Brent Is
Brent is the North Sea oil benchmark. Today the price reflects a basket of fields from the region and, since 2023, also WTI Midland cargoes delivered in Europe. The crude has about 38 API degrees and less than 0.5% sulfur. Futures contracts trade on the ICE exchange, in London.
Since it's extracted at sea and loaded directly onto ships, Brent easily reaches any part of the world. That's why it's the benchmark for about two-thirds of international oil contracts, dominant in Europe, Africa, and the Middle East. It's also the most used benchmark for Brazilian oil.
What WTI Is
WTI stands for West Texas Intermediate, the American oil traded on the Nymex exchange, part of the CME Group. It's a bit lighter and sweeter than Brent, with about 39 to 40 API degrees and around 0.24% sulfur.
The main difference is logistics: the contract calls for physical delivery in Cushing, Oklahoma, an inland storage hub connected to refineries by pipelines. When Cushing's tanks fill up, WTI can get much cheaper than Brent. The extreme case was April 20, 2020, when the near-expiration contract even closed below zero, because there was nowhere left to store the oil.
And Dubai
Less cited in Brazil, the Dubai and Oman benchmark represents Middle Eastern oil sold to Asia. It's heavier and has more sulfur than Brent and WTI, which makes refining more expensive. Many other types of crude are priced at a discount or premium to one of these three.

How to Calculate the Brent-WTI Spread
The spread is simply the difference between the two prices on the same day: spread = Brent − WTI. With the real closes:
- April 1, 2026: $101.16 − $100.12 = $1.04
- October 7, 2026: $100.20 − $88.28 = $11.92, or 13.5% over WTI's price (11.92 ÷ 88.28)
- Average over the period's 131 trading days: $5.27
Most of the time Brent was more expensive, but there were 5 trading days, all in early April, when WTI came out on top.
Real Example: Brent and WTI in 2026
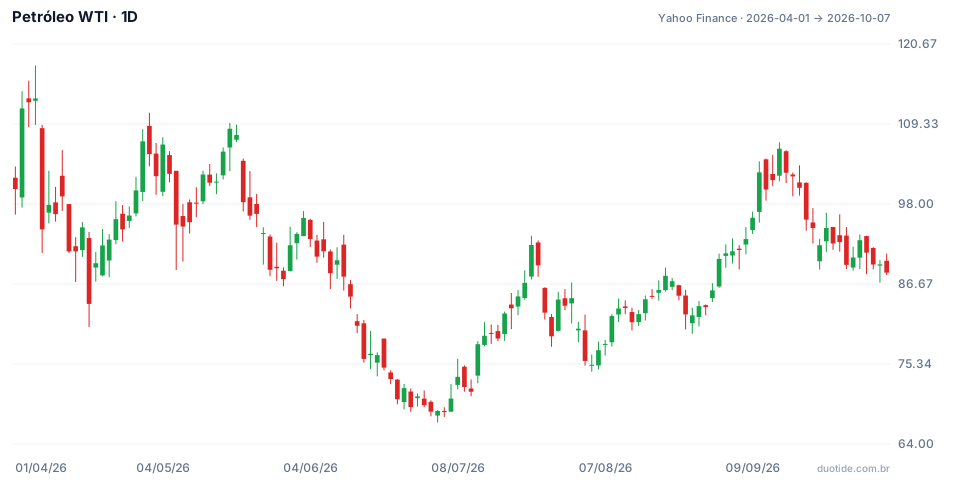
The chart shows WTI over the period. The price went from $100.12 on April 1, touched $117.63 on April 7, fell to a low of $67.04 on July 2, and closed on October 7 at $88.28, an 11.83% drop. Brent, over the same span, went from $101.16 to $100.20, a drop of just 0.95%. Three moments show how the two relate to each other:
April: WTI More Expensive and a Joint Decline
On April 7, WTI closed at $112.95 and Brent at $109.27, a spread of $3.68 in favor of the American crude. The next day both collapsed together: WTI fell 16.4%, to $94.41, and Brent 13.3%, to $94.75. By April 27, Brent was already $11.86 above WTI. Both moved in the same direction, but at different intensities, and the spread flipped sides in three weeks.
July: The Common Bottom
Both benchmarks marked the period's low on the same day, July 2: $67.04 for WTI and $70.14 for Brent. Over the entire period, the two closed in the same direction on 120 of 130 comparable trading days, or 92.3%. The underlying trend is the same, because both reflect global supply and demand.
September: The Spread Spikes
Between September 22 and September 23, Brent rose from $99.25 to $103.08, while WTI fell from $94.59 to $92.16. The spread went from $4.66 to $10.92 in one day and hit the window's peak, $13.21, on September 29. One caveat: continuous futures series roll over to a new expiration on different dates for Brent and WTI, and part of these jumps can come from that roll, not just from news.
How to Use Brent and WTI in Your Analysis
Know Which Benchmark Is Being Quoted
A contract, a CFD, or a news story can cite either Brent or WTI. With a spread of more than $10, as in October 2026, mixing up the two means getting the price wrong by more than 10%.
Read the Spread as a Regional Thermometer
A spread widening in Brent's favor usually signals supply tension outside the United States or slack inventories in the American market. A narrow or negative spread suggests the opposite. Weekly US inventory reports help read that move.
Follow the Common Factors
- Production decisions from major exporters.
- Geopolitical events that threaten shipping routes or producing fields.
- Economic activity data, since oil is an input for transportation and industry.
- Weekly inventories, which show whether supply is abundant or scarce.
Limitations
Continuous futures prices mix expirations and can produce artificial jumps when the contract rolls over. And the high correlation between Brent and WTI doesn't prevent moves of very different intensity, as on April 8, when the gap between their declines topped three percentage points.
Common Mistakes When Tracking Brent and WTI
- Comparing a news story's Brent price with a WTI chart and thinking the market has changed.
- Assuming the spread is fixed: in 2026 it ranged from $3.68 negative to $13.21 positive.
- Ignoring the futures contract's expiration, which can generate jumps that aren't real price movement.
- Trading oil without following weekly inventories and the major producers' calendar.
- Underestimating volatility: a 16.4% drop in a single day happened in the period analyzed.
To practice, open Brent and WTI charts side by side in your demo account and note the spread between them every week, along with what the news brought that was different for each region. That record shows, with your own data, when the two benchmarks move together and when they diverge.
Practice before you risk. Open your Duotide account and test your ideas on the demo account with US$10,000 in virtual funds.
Create free accountUpdated:
Editorial character of the Duotide newsroom. Articles are written by the team with the help of artificial intelligence; prices and charts come from real market data. Follows the news that moves prices — rates, stock markets, companies and commodities — explained without jargon.
Was this article helpful?
Be the first to rate it.
Comments
- No comments yet. Be the first to comment.
Ready to put it into practice?
Open your account and practice on the demo account with US$10,000 in virtual funds, without risking money.
- Secure platformProtected login and identity verification
- Multilingual supportHelp available every day
- Free demo accountUS$10,000 virtual to practice
Trading involves the risk of losing the capital invested.
