

 Português pt
 Español es
 العربية ar
 বাংলা bn
 Deutsch de
 Filipino fil
 Français fr
 हिन्दी hi
 Bahasa Indonesia id
 Italiano it
 Русский ru
 Svenska sv
 ไทย th
 Türkçe tr
 Tiếng Việt vi
 简体中文 zh
Updated:
StocksHow to Analyze Stocks Before Trading: Fundamentals and Technicals
 Rafael AzevedoEditorial character · Markets Desk

Quick answer
To analyze a stock before trading, combine two lenses: the fundamental one, which evaluates the company's revenue, profit, margin, debt, and price, and the technical one, which evaluates trend, support, resistance, and volume on the chart. The first tells you whether the company deserves attention; the second, whether the price's timing favors the entry. After that come the stop, the target, and the position size.
Picking a stock just because it's trending on social media is the most common way to decide on impulse. A structured analysis, one that combines the company's fundamentals with the price's behavior, doesn't eliminate risk, but it trades a guess for criteria you can check and repeat.
In this guide we lay out the roadmap and apply the technical part to Microsoft's real daily quotes (MSFT, from Yahoo Finance) between January and October 2026, a period in which the stock fell more than 25%, recovered all of it, and ended higher.
What analyzing a stock means
There are two complementary lenses. Fundamental analysis evaluates the company: whether it's growing, whether it's profitable, whether it's heavily indebted, and how much the market is paying for that. Technical analysis evaluates the price: trend, support, resistance, and volume. The first helps decide whether the company deserves attention; the second helps decide whether the price's timing favors a trade.

How to analyze a stock in five steps
1. The company's numbers
- Revenue and profit: are they growing consistently over the last few quarters, or are they stagnant?
- Margin: how much of the revenue turns into profit after costs and expenses.
- Debt: heavily indebted companies have less room to maneuver in tough periods.
- Price-to-earnings (P/E): how many years of current profit the market is paying for the stock. Compare with competitors in the same sector, not with the whole market.
This data is in the quarterly reports listed companies publish. Read the report and the earnings presentation, not just the headline about them.
2. The trend
A simple way is to compare the price with the 50- and 200-session moving averages. Price above both, with the 50 above the 200, points to an uptrend; the reverse, a downtrend.
3. Support and resistance
Mark the regions where the price has already stopped falling or rising more than once. They help define where the stop goes and whether the distance to the target is worth the risk.
4. The volume
Compare the day's volume with the average. Sharp moves with volume well above average show real participation and almost always have news behind them; find out what it was before trading.
5. The plan
Only after all that come the entry, stop, target, and position size. If the logical stop is too far away for your risk, the answer is to not trade, or to trade smaller.
Real example: Microsoft in 2026
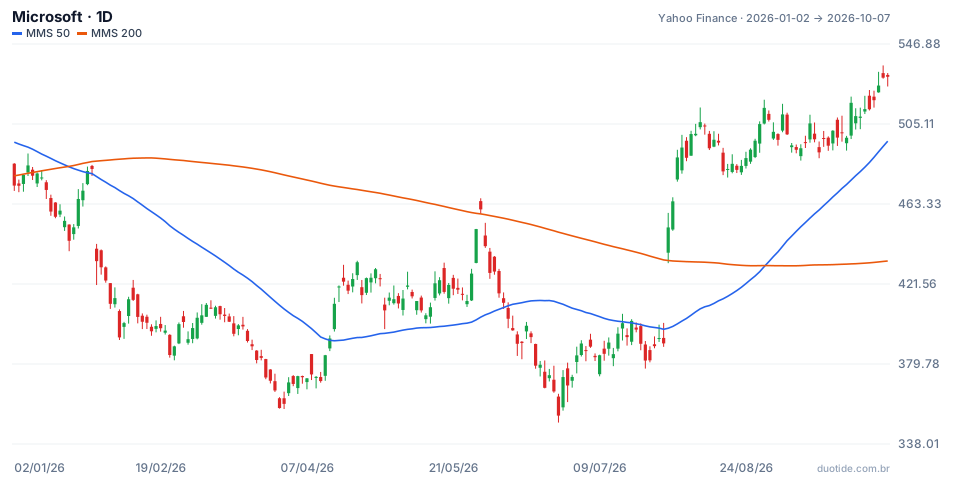
The chart shows Microsoft with the 50- and 200-session simple moving averages. The period's average daily volume was 34.5 million shares, and three days stood out well above that.
January 29: a 9.99% drop on volume 3.7 times the average
The stock went from US$ 481.63 to US$ 433.50 in one session, with 128.9 million shares traded. Late January is when Microsoft usually reports quarterly results, exactly the kind of news the fundamentals step tells you to check. Ten sessions later, the stock was at US$ 401.84, another 7.30% lower. Anyone who treated the drop as a discount without looking at the trend fought the move: on January 21, the 50 average had already crossed below the 200.
June 25 and 26: the bottom, with the period's highest volume
The window's low came on June 25, at US$ 349.20. The next day, the stock rose 5.71%, to US$ 372.97, with 186.2 million shares traded, 5.4 times the average. Extreme volume near a bottom shows a lot of people changing position, but it doesn't confirm a reversal on its own: the stock was still below both averages.
July 30: a 15.51% rally and a trend reversal
From US$ 390.54 to US$ 451.10, on 110.2 million shares, 3.2 times the average, again at the end of an earnings quarter. The price moved straight above the 200 average (US$ 433.83 that day). Ten sessions later it was at US$ 496.88, up 10.15%. On August 31, the 50 average crossed above the 200, with the price at US$ 507.29, and the stock closed October 7 at US$ 529.76, near the period's high, US$ 535.69 on October 6.

How to use the analysis in practice
When fundamentals and the chart agree
Strong results and a price in an uptrend, with volume confirming, form the most coherent scenario. Even so, the stop is still mandatory.
When they disagree
Good numbers with a falling price can mean the market is pricing in a risk that hasn't shown up in the results yet. Investigate before buying on the fundamentals alone.
Review often
The numbers change every quarter and the chart changes every day. Before adding to a position, check whether the reasons that led to the trade still hold.
Limitations
Moving averages lag: Microsoft's bullish crossover came more than a month after the price turned. High volume shows intensity, not future direction. And the fundamentals can take quarters to show up in the price. The examples describe what happened, not what will happen.
Common mistakes when analyzing stocks
- Deciding based on a news item or someone else's recommendation without checking the numbers.
- Confusing a good company with a cheap stock: the price may already price in all the optimism.
- Buying a sharp drop without looking at the trend and without knowing what news caused it.
- Ignoring volume and treating every move as equally relevant.
- Forgetting the sector: a drop in profit can belong to the company or to the whole sector.
To practice, pick two or three stocks on a demo account, apply the five steps before every trade, and log what each step indicated and what the price did afterward. Within a few weeks you'll know which steps make a difference in your process.
Practice before you risk. Open your Duotide account and test your ideas on the demo account with US$10,000 in virtual funds.
Create free accountUpdated:
Editorial character of the Duotide newsroom. Articles are written by the team with the help of artificial intelligence; prices and charts come from real market data. Follows the news that moves prices — rates, stock markets, companies and commodities — explained without jargon.
Was this article helpful?
Be the first to rate it.
Comments
- No comments yet. Be the first to comment.
Ready to put it into practice?
Open your account and practice on the demo account with US$10,000 in virtual funds, without risking money.
- Secure platformProtected login and identity verification
- Multilingual supportHelp available every day
- Free demo accountUS$10,000 virtual to practice
Trading involves the risk of losing the capital invested.
