

 Português pt
 Español es
 العربية ar
 বাংলা bn
 Deutsch de
 Filipino fil
 Français fr
 हिन्दी hi
 Bahasa Indonesia id
 Italiano it
 Русский ru
 Svenska sv
 ไทย th
 Türkçe tr
 Tiếng Việt vi
 简体中文 zh
Updated:
StrategiesHow to Choose a Trading Strategy Based on Your Profile
 Naomi TanakaEditorial character · Analysis Desk

Quick answer
To choose a strategy based on your profile, start with the time you have to follow the market, then the loss you accept per trade, the capital available, and your temperament. The right strategy is the one you can follow with discipline, and its stop needs to fit within the risk you accept. There's no strategy that's best for everyone.
There's no best trading strategy in the abstract. There's the strategy that fits your routine, your wallet, and your temperament. A rule that works for someone who sits in front of the screen for eight hours can be a disaster for someone who can only look at the chart at night, and a strategy with wide stops can be unworkable for a small account.
In this guide, we show the four criteria that define your profile and use the Ibovespa's real volatility between April and October 2026 to show, with numbers, how capital and risk tolerance limit your choices.
What defines your trader profile
Available time
- A few hours a day, during trading hours: allows day trading, on 5- to 15-minute charts.
- One hour a day, outside trading hours: fits swing trading, trades lasting a few days to a few weeks on the daily chart, with orders left on the platform.
- A few hours a week: fits position trading, from weeks to months, on the weekly chart.
Risk tolerance
It isn't how much you think you can handle, but how much you can lose without changing your behavior: without doubling the position to recover, without removing the stop, without abandoning the plan. A simple test is to write down the loss per trade and the monthly loss you'd accept without suffering, and start with half of that.
Capital
Capital decides whether the strategy's technical stop fits within the loss you're willing to accept. If it doesn't fit, the strategy isn't right for that account size, however good it may be.
Personality
Anyone who needs a fast result struggles with trades that take weeks. Anyone who gets stressed by decisions made in seconds struggles with day trading. The strategy you can actually follow for months is worth more than the theoretically best one you abandon in two weeks.

How to calculate whether a strategy fits your capital
The math uses the ATR (average true range), which measures how much the asset swings per day on average. With it:
- Stop distance: a multiple of the ATR, say 1 ATR, so you aren't hit by normal swings.
- Risk per contract: stop distance × the value of each point.
- Fits or doesn't: if the risk of a single contract exceeds the loss you accept per trade, the strategy doesn't fit the account.
On the Ibovespa mini contract traded on B3, each point is worth R$ 0.20. The futures contract quotes a little differently from the spot index, but the daily swing in points is similar, which is why we use the index's ATR as an approximation.
Real example: the Ibovespa's volatility in 2026
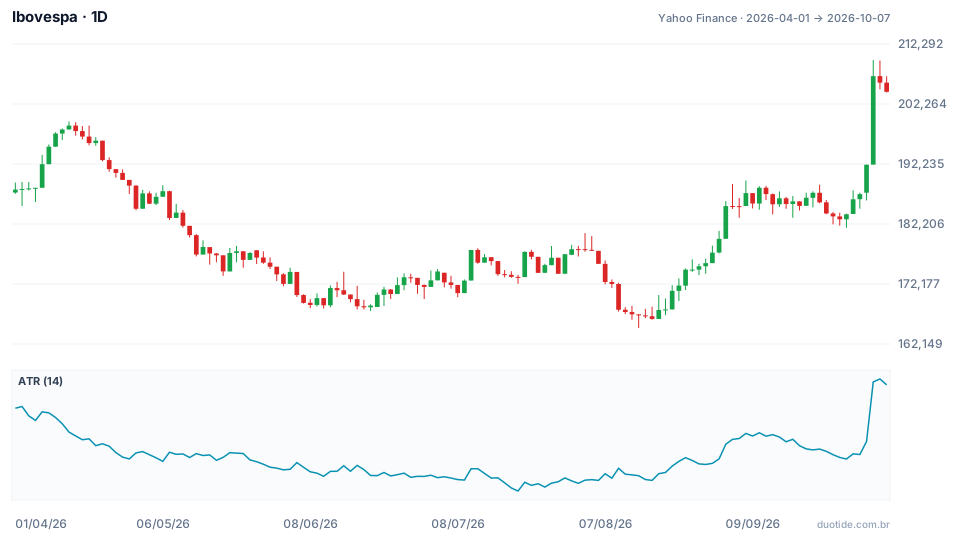
The bottom panel shows the Ibovespa's 14-day ATR. Between April 1 and October 7, 2026, the index went from 187,953 to 204,302 points (up 8.7%), with a low of 164,835 on August 14 and a high of 209,606 on October 5. The ATR nearly doubled over that window, and that changes who can actually trade it.
July: low swing
On July 21, the ATR stood at 2,194 points, the period's lowest value, equal to 1.27% of the index. A 1 ATR stop on the mini contract represented 2,194.41 × R$ 0.20 = R$ 438.88 per contract. A R$ 50,000 account risking 1% per trade (R$ 500) could hold one contract.
October: high swing
On October 5, the index opened from the previous close of 192,115 points and closed at 206,912, up 7.7% in a single session. The ATR rose to 4,133 points on October 6 and stood at 4,031 on October 7, 1.97% of the index. The same 1 ATR stop now cost 4,031.30 × R$ 0.20 = R$ 806.26 per contract. The R$ 50,000 account with a R$ 500 limit could no longer hold even one contract with that stop.
What changes across assets
On October 7, the ATR as a percentage of price was 0.58% for EUR/USD, 0.86% for the S&P 500, 1.97% for the Ibovespa, 2.26% for gold, 2.36% for Nvidia, and 2.63% for bitcoin. For the same money risk, the higher that number, the smaller the possible position. Anyone with low tolerance for swings tends to do better with assets toward the bottom of that list. These values describe the period analyzed; volatility keeps changing.

How to choose the strategy in practice
Start with the time, not the method
First decide what hours and for how long you can follow the market. That alone rules out a good chunk of the options.
Do the risk math before choosing the asset
Calculate the risk of one unit with the strategy's technical stop, as in the example above. If it doesn't fit, pick a less volatile asset, a smaller contract, or a timeframe where the stop is smaller.
Test for long enough
Give a strategy at least a few dozen trades before judging it. Switching methods every week makes it impossible to tell whether the problem is the strategy or the execution.
Limitations
Your profile changes: more free time, more capital, or more experience can open up other options. And no combination of profile and strategy guarantees a result; it only raises the odds you'll actually follow the plan.
Common mistakes when choosing a strategy
- Choosing day trading without having availability during trading hours.
- Copying someone else's strategy with very different capital and risk tolerance.
- Ignoring that volatility changes: a stop that fit in July might not fit in October.
- Shrinking the stop below the normal swing just to fit the account.
- Switching strategies after a few losses, without a large enough sample.
To practice without risking money, write your profile in four lines (time, acceptable loss, capital, and temperament), pick a compatible strategy, and trade on a demo account for a few weeks, logging every trade and how you felt following it. The record shows whether the strategy really fits you.
Practice before you risk. Open your Duotide account and test your ideas on the demo account with US$10,000 in virtual funds.
Create free accountUpdated:
Editorial character of the Duotide newsroom. Articles are written by the team with the help of artificial intelligence; prices and charts come from real market data. Explains charts, indicators and trading strategies: how they work, where they fail and how to test them first.
Was this article helpful?
Be the first to rate it.
Comments
- No comments yet. Be the first to comment.
Ready to put it into practice?
Open your account and practice on the demo account with US$10,000 in virtual funds, without risking money.
- Secure platformProtected login and identity verification
- Multilingual supportHelp available every day
- Free demo accountUS$10,000 virtual to practice
Trading involves the risk of losing the capital invested.
