

 Português pt
 Español es
 العربية ar
 বাংলা bn
 Deutsch de
 Filipino fil
 Français fr
 हिन्दी hi
 Bahasa Indonesia id
 Italiano it
 Русский ru
 Svenska sv
 ไทย th
 Türkçe tr
 Tiếng Việt vi
 简体中文 zh
Updated:
ETFs & indicesHow to Diversify Your Trading Using ETFs
 Rafael AzevedoEditorial character · Markets Desk
Quick answer
To diversify with ETFs, combine funds that track broad indices with funds from other asset classes, like gold or bonds, instead of concentrating everything in one stock or sector. That reduces the risk of a specific company, but doesn't eliminate broad market drops. Before building the basket, check that the ETFs don't hold the same companies.
Anyone trading a single stock is exposed to everything that happens to that one company: a bad result, a change in management, regulatory news. An ETF, an exchange-traded fund that tracks an index or a basket of assets, dilutes that specific risk, because one bad company carries little weight among dozens or hundreds of others.
In this guide, we use real daily quotes from the S&P 500 (the index the main US stock ETFs track), Nvidia, Apple, and gold between April and October 2026 to measure how much diversification reduced the swings, and also what it didn't do.
What diversifying with ETFs means
Diversifying means combining assets that don't rise and fall exactly together. With ETFs, this can be done in layers:
- Broad index ETFs: track indices like the S&P 500 or the Ibovespa and spread the risk across many companies.
- Sector ETFs: concentrate on one sector (technology, energy, banks). They diversify across companies, but not across sectors.
- Commodity and other asset-class ETFs: gold, government bonds, currencies. They add something that doesn't depend on companies' profits.
One important detail: the ETF tracks the index, but it isn't the index. The fund's share price is on a different scale, and the expense ratio makes the return land a little below the index over time. In the numbers below, we use the index itself as the reference.

How to measure the effect of diversification
Three numbers are enough to compare a single asset with a basket, all calculated from the daily closes:
- Daily volatility: the standard deviation of day-to-day moves. The higher it is, the more the price shakes.
- Biggest drop from the peak: the distance between the highest close so far and the worst close that follows.
- Worst day: the biggest negative move in a single session.
Between April 1 and October 7, 2026, the results were these:
- S&P 500: up 18.65%; daily volatility of 0.77%; biggest drop from the peak of 4.5% (through June 10); worst day of −2.64% (June 5).
- Nvidia: up 35.12%; daily volatility of 2.41%; biggest drop of 19.4% (through July 29); worst day of −6.2% (June 5).
- Apple: up 31.7%; daily volatility of 1.71%; biggest drop of 12.71% (through June 25); worst day of −7.35% (July 31).
- Gold: down 13.97%; daily volatility of 1.43%; biggest drop of 18.19% (through July 16).
Real example: S&P 500, Nvidia, and gold in 2026
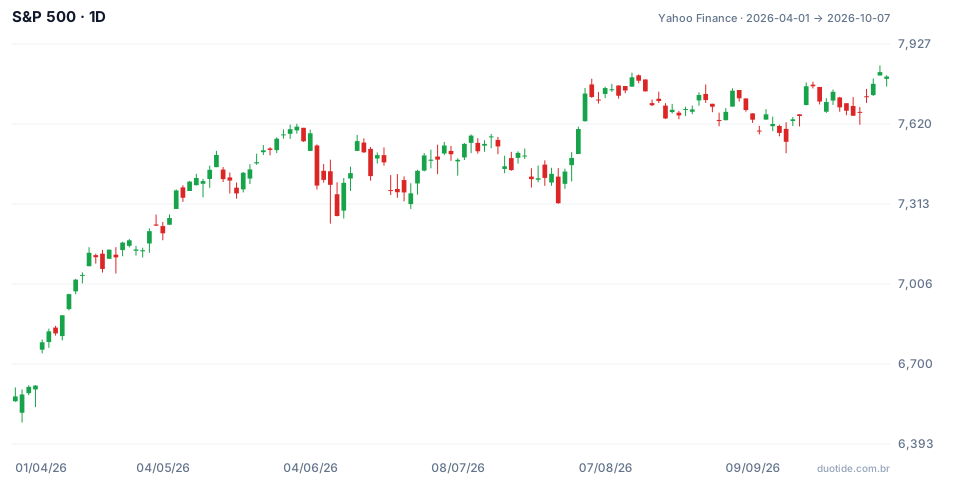
The chart shows the S&P 500 going from 6,575.32 points on April 1 to 7,801.77 on October 7, with a low of 6,474.94 on April 2 and a high of 7,844.52 on October 6. Three moments from the period show what diversification does.
Same amount, very different scares
Imagine US$ 10,000 invested on April 1. In Nvidia alone, that would have grown to US$ 13,511.81 by October 7, but along the way it would have gone through a 19.4% drop from the peak. In the index alone (via ETF), it would have grown to US$ 11,865.23, with a biggest drop of only 4.5%. The individual stock returned more over this period, but it required surviving a mid-course loss more than four times bigger. For anyone trading with leverage or a tight stop, that difference decides whether the position survives.
The risk of a single company: July 31
On July 31, 2026, Apple fell 7.35% in a day, from US$ 333.43 to US$ 308.91. In the same session, the S&P 500 rose 0.7%. Anyone who held Apple inside an index ETF barely felt the drop; anyone who held only Apple lost, in one day, the equivalent of months of the index's normal swings.
When everything falls together: June 5
On June 5, 2026, the S&P 500 fell 2.64%, Nvidia fell 6.2%, and gold fell 3.1%. Diversifying between stocks and gold didn't avoid the loss that day. Over the six months analyzed, the correlation between the S&P 500's and gold's daily moves was 0.48: they moved in the same direction more often than people tend to assume.
And diversifying doesn't guarantee a better return. A US$ 10,000 basket split evenly between the index and gold ended the period at US$ 10,234.11 (up 2.34%), because gold fell. That basket's biggest drop was 7.71%, bigger than the index alone. These are facts from one specific period; in another, gold might have been exactly what held the portfolio up.

How to use ETFs to diversify
Start with a broad index ETF
It solves single-company risk in one move. Individual stock trades can layer on top, in smaller size.
Watch out for overlap
An S&P 500 ETF, a technology ETF, and Nvidia and Apple stock look like four positions, but a good part of them is the same bet, because those companies carry a lot of weight in the index. Over the period, the daily correlation between the S&P 500 and Nvidia was 0.61.
Measure the correlation, don't assume it
Take a few months of daily closes and calculate the correlation between the assets you plan to combine. Values near 1 mean they move together; near 0, that they move independently. Correlation changes over time, so redo the calculation periodically.
Limitations
ETFs reduce specific risk, not market risk. In broad downturns, most assets fall together. Leveraged and inverse ETFs behave differently day to day and aren't a diversification tool for beginners.
Common mistakes when diversifying with ETFs
- Buying several ETFs that hold the same companies and thinking you're diversified.
- Expecting diversification to increase returns: its job is to reduce swings, and sometimes it also reduces the gain.
- Ignoring the chosen ETF's expense ratio and liquidity.
- Assuming gold or another asset class always rises when stocks fall; on June 5, 2026, it fell along with them.
- Drawing conclusions from a single period: the numbers above describe what happened, not what will happen.
To practice without risking money, build two portfolios of the same value on a demo account, one concentrated in a single stock and the other in an index ETF, and log the value of each one weekly, along with the biggest drop from the peak. After a few months, you'll have your own measure of how much diversification smooths the ride.
Practice before you risk. Open your Duotide account and test your ideas on the demo account with US$10,000 in virtual funds.
Create free accountUpdated:
Editorial character of the Duotide newsroom. Articles are written by the team with the help of artificial intelligence; prices and charts come from real market data. Follows the news that moves prices — rates, stock markets, companies and commodities — explained without jargon.
Was this article helpful?
Be the first to rate it.
Comments
- No comments yet. Be the first to comment.
Ready to put it into practice?
Open your account and practice on the demo account with US$10,000 in virtual funds, without risking money.
- Secure platformProtected login and identity verification
- Multilingual supportHelp available every day
- Free demo accountUS$10,000 virtual to practice
Trading involves the risk of losing the capital invested.
