

 Português pt
 Español es
 العربية ar
 বাংলা bn
 Deutsch de
 Filipino fil
 Français fr
 हिन्दी hi
 Bahasa Indonesia id
 Italiano it
 Русский ru
 Svenska sv
 ไทย th
 Türkçe tr
 Tiếng Việt vi
 简体中文 zh
Updated:
ETFs & indicesETF Evaluation: Liquidity, Fees, and Tracking Error
 Rafael AzevedoEditorial character · Markets Desk

Quick answer
To evaluate an ETF, look beyond past performance: check which index it tracks, the expense ratio, how far the return strays from the index (tracking error), and liquidity, that is, volume and spread. In 2026, SPY rose 13.77% through October 7, against the S&P 500's 13.75%, with an average volume of 62 million shares a day.
An ETF, short for exchange traded fund, is a fund that pools together a basket of assets and is bought and sold on the exchange as if it were a stock. Instead of picking companies one by one, you buy a slice of an entire basket, almost always tied to a benchmark index.
The most common way to choose poorly is to look only at past performance, which is what shows up on best ETF lists. In this guide we lay out the criteria that matter and apply two of them to real data: SPY, one of the most traded ETFs in the world, compared with the S&P 500 index it tracks, using daily quotes from Yahoo Finance from January to October 2026. SPY appears here only as an analysis example, not as a recommendation.
What to evaluate in an ETF
- Benchmark index: exactly what the fund tracks and whether that fits your goal.
- Expense ratio: the cost charged every year on the assets, whatever happens to the market.
- Tracking error and return difference: how closely the ETF actually follows the index.
- Liquidity: traded volume and the bid-ask spread.
- Structure: whether it buys the index's assets or uses derivatives, whether it passes through or reinvests dividends, and what currency it trades in.

How to calculate the impact of the fee
The fee looks small because it's annual, but it compounds. A hypothetical example: R$ 10,000 invested for 20 years in an index that returned 8% a year before costs.
- ETF with a 0.1% annual fee: 10,000 × 1.079 to the power of 20 = R$ 45,753.98.
- ETF with a 0.6% annual fee: 10,000 × 1.074 to the power of 20 = R$ 41,695.16.
- Difference: R$ 4,058.82, from just half a percentage point of cost per year.
Two ETFs on the same index, with identical gross performance, deliver quite different results to the investor because of this.
Real example: SPY compared with the S&P 500
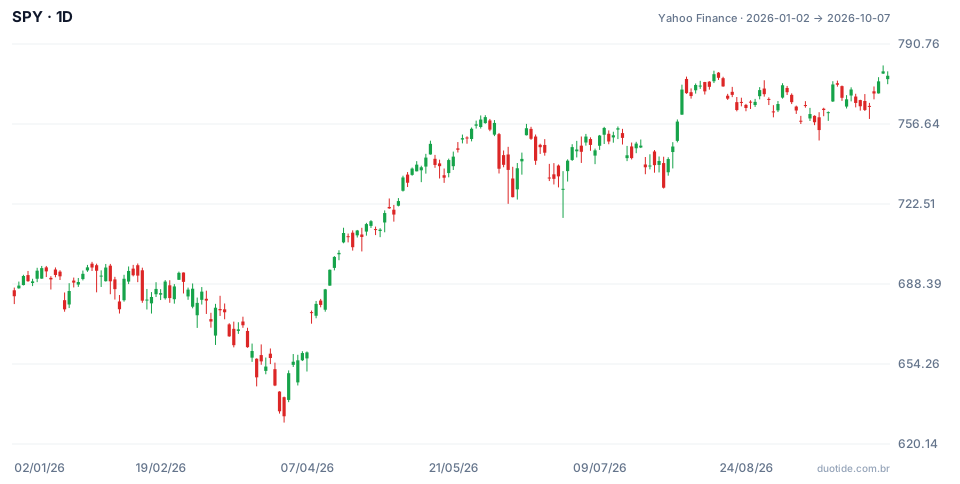
The chart shows SPY's price from January 2 to October 7, 2026. The price went from US$ 683.17 to US$ 777.22, up 13.77%. Over the same period, the S&P 500 went from 6,858.47 to 7,801.77 points, up 13.75%. The ETF's closing low came on March 30 (US$ 631.97) and the high on October 6 (US$ 779.09), the same dates as the index's closing low and high.
Return difference and tracking error
The return difference over the period was 0.02 percentage points. Comparing the price's daily moves with the index's, the typical difference (standard deviation) was 0.08 percentage points a day. The days with the biggest negative difference were June 18 (−0.30 points), September 18 (−0.29), and March 20 (−0.19), which coincide with the quarterly dates the shares start trading without the dividend. The S&P 500 price index doesn't subtract dividends, but the ETF does, because it passes them on to shareholders. That's why, to evaluate an ETF that distributes dividends, you should compare it with the total-return version of the index, or add back the dividends received.
There was also a one-off gap on June 26 (−0.68 points), largely undone the next session (+0.47 points on June 29). Differences like this usually come from the time each close gets recorded, not from the fund failing to track the index. That's why tracking error is assessed over long periods, not on a single isolated day.
Liquidity
SPY traded an average of 62.27 million shares a day over the period, about US$ 44.32 billion a day. The weakest day was August 25, with 27.4 million shares, and the strongest, March 20, with 163.6 million. With that volume, building or unwinding a retail-sized position doesn't move the price. An ETF that trades a few thousand shares a day is a different story: the spread can cost more than a full year's fee.

How to use these criteria
Start with the goal
Before comparing ETFs, decide what you want: Brazilian stocks, US stocks, fixed income, gold. Only then compare the funds that track the same index.
Among funds on the same index
Compare the return difference against the index over several years, the fee, and the volume. A cheaper fund that tracks the index worse can end up costing more in practice.
Check liquidity at your trading hours
Look at the average volume over the last few months and the spread at the time you usually trade. On thinly traded ETFs, use a limit order instead of a market order.
Limitations
These criteria show whether the ETF is a good vehicle for the index, not whether the index will rise. Past performance, including the example above, describes what happened and doesn't guarantee the future. Taxes and exchange rates also change the final result and vary by the investor's country.
Common mistakes when evaluating an ETF
- Choosing by last year's performance ranking.
- Ignoring the fee because it looks small.
- Comparing a dividend-paying ETF with a price index and concluding it fell behind.
- Buying a low-liquidity ETF with a market order.
- Not reading the prospectus to know what the fund actually holds.
To practice, pick two ETFs on the same index, note down each one's close and the index's close over a few weeks, and calculate the return difference. If you want to practice execution, use a demo account and log the spread you found at each time of day.
Practice before you risk. Open your Duotide account and test your ideas on the demo account with US$10,000 in virtual funds.
Create free accountUpdated:
Editorial character of the Duotide newsroom. Articles are written by the team with the help of artificial intelligence; prices and charts come from real market data. Follows the news that moves prices — rates, stock markets, companies and commodities — explained without jargon.
Was this article helpful?
Be the first to rate it.
Comments
- No comments yet. Be the first to comment.
Ready to put it into practice?
Open your account and practice on the demo account with US$10,000 in virtual funds, without risking money.
- Secure platformProtected login and identity verification
- Multilingual supportHelp available every day
- Free demo accountUS$10,000 virtual to practice
Trading involves the risk of losing the capital invested.
