

 Português pt
 Español es
 العربية ar
 বাংলা bn
 Deutsch de
 Filipino fil
 Français fr
 हिन्दी hi
 Bahasa Indonesia id
 Italiano it
 Русский ru
 Svenska sv
 ไทย th
 Türkçe tr
 Tiếng Việt vi
 简体中文 zh
Updated:
ETFs & indicesHow to Trade Indices: A Complete Guide for Beginners
 Rafael AzevedoEditorial character · Markets Desk

Quick answer
A stock index, like the Ibovespa or the S&P 500, is a number that summarizes the performance of a group of companies and can't be bought directly. It's traded through instruments that track it: ETFs (like BOVA11), futures contracts (like the mini index, at R$0.20 per point), and CFDs. The instrument you choose determines the trade's cost, leverage, and risk.
A stock index isn't a security you buy on the exchange like a regular stock. It's a number that summarizes the behavior of a group of companies. When the news says the Ibovespa fell 1% in a day, it's talking about that number, calculated from dozens of stocks at once.
Trading indices is popular for exactly that reason: instead of picking one company and running the risk of an isolated problem, the trader gets exposure to an entire market. In this guide we explain how indices work, the ways to trade them, and we use real daily Ibovespa quotes (Yahoo Finance) between April and October 2026 to show what these moves mean in money terms.
What a stock index is
An index is a theoretical basket of stocks, with public rules for entry, exit, and each company's weight. The main ones:
- Ibovespa: B3's main index, made up of the most heavily traded stocks on the Brazilian exchange.
- S&P 500: 500 large companies in the United States.
- Nasdaq 100: the largest non-financial companies listed on the Nasdaq, heavily weighted toward technology.
- Dow Jones: 30 large American companies, calculated on a price-weighted basis.
- Sector indices: slices by sector, such as energy, banks, or consumer goods.
In most indices, each company's weight follows the market value of its shares outstanding, with caps so none dominates too much. That's why a few large companies can move the entire index in a single day.

How to calculate the result of an index trade
Nobody buys the index directly. It's traded through instruments that track its value, each with its own math:
- ETF: a fund traded like a stock that replicates the index, such as BOVA11 for the Ibovespa. The result is the share's percentage change.
- Ibovespa mini futures contract (WIN): on B3, each point is worth R$0.20 per contract. Result = points of change × 0.20 × number of contracts.
- Full contract (IND): each point is worth R$1.00 per contract.
- Index CFD: offered by international brokers, with a per-point value set in the contract and leverage.
Futures contracts require margin and have a daily settlement. The ETF has no leverage: the money invested is the exposure.
Real example: the Ibovespa between April and October 2026
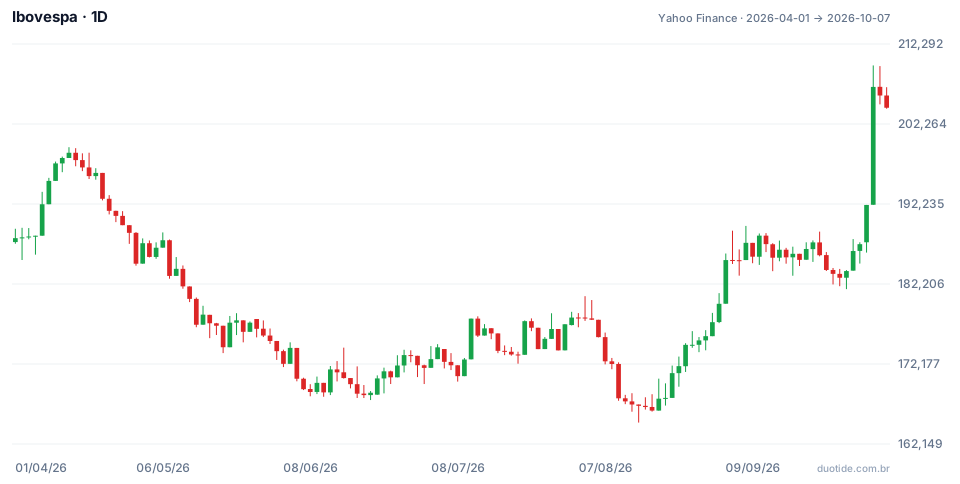
The Ibovespa closed April 1, 2026 at 187,953 points and October 7, 2026 at 204,302, up 8.7%. Along the way, though, there was a long decline in the middle, and that's where the size of the risk shows up.
April to August: a 17% decline
The high of the first stretch was 199,355 points, on April 14. From there the index fell to a low of 164,835 points on August 14, a decline of 17.32%. The worst day of the period was August 11, when the Ibovespa closed at 167,875 points, down 2.50% from 172,180 the day before. On a mini contract, that single day would amount to 4,305 points × R$0.20 = R$861 per contract. On the full contract, R$4,305.
October: the biggest day of the period
On October 5, the first session after the first round of the general election on October 4, the Ibovespa rose 7.70%, from 192,115 to 206,912 points, and hit the period's high, 209,606. That's 14,797 points, or about R$2,959 per mini contract in a single day, in favor of whoever was long and against whoever was short. The numbers use the spot index; the futures contract has its own price and can differ slightly.
More volatile than the S&P 500
Over the same period, the Ibovespa's average daily move, in absolute terms, was 0.84%, versus 0.60% for the S&P 500. The Brazilian index swung more per day, which calls for smaller positions for the same level of risk.

How to trade indices
Day trading
Day trading opens and closes positions on the same day, usually with mini contracts, taking advantage of the mini index's high liquidity. It requires a defined stop, cost control, and attention to news that moves the whole market, such as interest rates, inflation, and the political backdrop.
Swing trading and position trading
In swing trading the position lasts days or weeks, following the trend on the daily chart. For longer horizons, the ETF tends to be simpler: it has no expiration, no daily settlement, and no leverage.
Position size by risk
Set the stop in points and calculate how many contracts fit within the maximum accepted loss. With a 1,000-point stop and a maximum loss of R$400, that's 400 ÷ (1,000 × 0.20) = 2 mini contracts.
Limitations
Indices diversify away single-company risk, but not market risk: in a broad decline, almost all stocks fall together, as happened between April and August. Futures expire and need to be rolled, and their price differs from the spot index. The numbers in this article describe what happened, not what will happen.
Common mistakes when trading indices
- Thinking an index is always low risk: the Ibovespa fell 17.32% between April and August 2026.
- Trading the full contract when the account size calls for the mini contract.
- Ignoring the events calendar, like elections and interest rate decisions, which move the whole index at once.
- Confusing the futures price with the spot index price.
- Not having a stop on leveraged trades.
- Comparing indices from different countries without considering each one's volatility.
To get started, follow the index you plan to trade on a demo account for a few weeks, simulate entries with a calculated stop and size, and log every result in points and in money. The log quickly shows whether your position size matches your account.
Practice before you risk. Open your Duotide account and test your ideas on the demo account with US$10,000 in virtual funds.
Create free accountUpdated:
Editorial character of the Duotide newsroom. Articles are written by the team with the help of artificial intelligence; prices and charts come from real market data. Follows the news that moves prices — rates, stock markets, companies and commodities — explained without jargon.
Was this article helpful?
Be the first to rate it.
Comments
- No comments yet. Be the first to comment.
Ready to put it into practice?
Open your account and practice on the demo account with US$10,000 in virtual funds, without risking money.
- Secure platformProtected login and identity verification
- Multilingual supportHelp available every day
- Free demo accountUS$10,000 virtual to practice
Trading involves the risk of losing the capital invested.
