

 Português pt
 Español es
 العربية ar
 বাংলা bn
 Deutsch de
 Filipino fil
 Français fr
 हिन्दी hi
 Bahasa Indonesia id
 Italiano it
 Русский ru
 Svenska sv
 ไทย th
 Türkçe tr
 Tiếng Việt vi
 简体中文 zh
Updated:
StrategiesHow to Set Up a Trading Bot, Step by Step
 Naomi TanakaEditorial character · Analysis Desk

Quick answer
To set up a trading bot, write clear entry and exit rules, set a stop proportional to the asset's volatility, and calculate each position's size from the loss you're willing to accept. Then test the rule on historical data and on a demo account before using real money. The bot executes exactly what it was configured to do, including the mistakes.
A trading bot is a set of rules written so a program can execute them on its own: when condition X happens, buy; when condition Y happens, sell. It doesn't think, doesn't interpret news, and doesn't know whether the market's behavior has changed. It does exactly what it was told, including the mistakes.
In this guide, we build a simple bot from start to finish and test it on ether's real daily quotes (ETH/USDT on Binance) between April and October 2026. The goal isn't to sell the rule, but to show where the setup makes a difference: the stop and the position size mattered more to the result than the entry signal.
What a trading bot needs to have
Before any code or visual builder, write the strategy in sentences that leave no doubt. Every bot needs four pieces:
- Entry condition: what needs to happen to open the trade.
- Profit-exit condition: a target, an opposite signal, or a stop that trails the price.
- Loss-exit condition (the stop): the point where the idea is wrong. A bot with no stop isn't an automated strategy, it's automated risk.
- Position size: how much to buy on each signal, calculated from how much you're willing to lose.
If you can't explain the rule to someone else without using the word “depends,” the bot won't be able to execute it either.

How to set up the bot, step by step
Step 1: the entry and exit rule
Our example uses two exponential moving averages on the daily chart: the 9-period one (fast) and the 21-period one (slow). The bot buys at the close of the day the 9 crosses above the 21 and sells at the close of the day it crosses below. It's a common rule in introductory material precisely because it's easy to program.
Step 2: the stop, measured by volatility
A commonly seen setup is a fixed stop 2% below the entry. The problem is that 2% can be too little or too much, depending on the asset. A better way is to measure volatility with the 14-period ATR (average true range) and set the stop at a multiple of it, say 2 ATR.
Step 3: the position size
With the stop defined, the size comes from a simple calculation: size = the amount you're willing to lose ÷ the distance to the stop. With the real numbers from the April 7, 2026, signal:
- Entry price: US$ 2,240.01; 14-day ATR that same day: US$ 108.02 (4.82% of the price).
- Stop at 2 ATR: 2 × 108.02 = US$ 216.04 → stop at US$ 2,023.97.
- A US$ 10,000 account risking 1% per trade: a maximum loss of US$ 100.
- Size: 100 ÷ 216.04 = 0.46 ETH, a position of about US$ 1,036.85.
Notice the position came out to about 10% of the account, not the whole account. That's what makes a losing streak survivable.
Step 4: costs and execution
In the test, set a fee per trade (say, 0.1% on the buy and 0.1% on the sell, a hypothetical value) and some gap between the signal price and the executed price. Strategies that trade often can have their entire profit eaten up by costs that don't show up on the chart.
Real example: the moving-average bot on ether in 2026
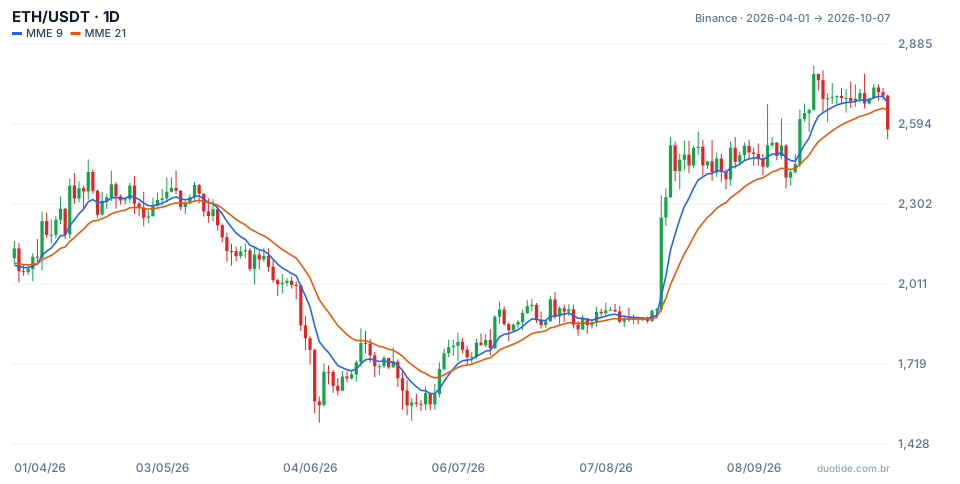
In the chart, the blue line is the 9-day exponential average and the orange one, the 21-day. Between April 1 and October 7, 2026, ETH went from US$ 2,140.35 to US$ 2,574.14 (up 20.27%), with a low of US$ 1,505.68 on June 6 and a high of US$ 2,807.34 on September 21. The averages crossed only three times over the period, and each crossover teaches something different.
April: the 2% stop would have knocked the bot out the next day
The bullish crossover on April 7 signaled a buy at US$ 2,240.01. With a fixed 2% stop, the exit would sit at US$ 2,195.21, and April 8's low was US$ 2,179.78: the bot would be stopped out in one day. With a 2 ATR stop (US$ 2,023.97), the trade survived, because the lowest low before the exit was US$ 2,157.31, on April 9. The price reached US$ 2,464.91 on April 17 (10.04% above the entry).
May: the exit signal gave back almost all the gain
The bearish crossover only came on May 14, with ETH at US$ 2,283.25. The trade ended with a gross gain of 1.93%, far less than the 10.04% the price had offered at one point. Moving averages exit late by construction; anyone who wants to protect part of the gain needs another rule, like a trailing stop or a partial target. In the 10 days after that bearish crossover, ETH fell another 8.03%.
July: the same stop lesson, and a long trend
The bullish crossover on July 5 signaled a buy at US$ 1,785.65. Again, the 2% stop (US$ 1,749.94) would have been hit the next day, with July 6's low at US$ 1,728.95. The 2 ATR stop sat at US$ 1,623.77 (ATR of US$ 80.94, or 4.53% of the price) and wasn't touched: the lowest low after the entry was US$ 1,713.44, on July 8. Through October 7 there was no bearish crossover, and the open position had built up a 44.16% gain.
With the 2% stop, both buys would have turned into two small losses. With the volatility-based stop, they ended with one small gain and one large gain. Same entry signal, opposite results. That describes what happened in this stretch of ETH; in another period, the same rule could lose.

How to test the bot before switching it on
Backtest over several periods
Three signals in six months is too small a sample for any conclusion. Run the rule over a few years of data, including uptrends, downtrends, and sideways stretches, and note the win rate, average gain, average loss, and the longest losing streak.
Demo account before real money
After the backtest, let the bot run on a demo account for a few weeks. That's where problems the historical test can't show up show up: an order that doesn't execute, a connection that drops, a signal that fires twice.
Ongoing monitoring
A bot switched on doesn't mean a bot forgotten. Set a daily or monthly loss limit that, if hit, turns off the automation until you review what changed.
Limitations
A bot only executes what it was programmed to do. It doesn't react to news, doesn't notice when the market shifts from trending to sideways (a phase when moving-average crossovers tend to generate back-to-back losing entries and exits), and it can repeat a mistake hundreds of times before anyone notices.
Common mistakes when setting up a trading bot
- Switching on the bot with no stop, or with a stop that ignores the asset's volatility, like the 2% that would have been hit in one day in the example above.
- Using the entire account on every trade, instead of calculating the size from the acceptable loss.
- Tuning the parameters until the backtest looks perfect: the rule starts describing the past and fails in the future.
- Forgetting fees and execution slippage in the test.
- Concluding the rule works based on a handful of signals. The examples above show what happened, not what will happen.
To practice without risking money, build this same rule on a demo account, with an ATR-based stop and a size calculated from the acceptable loss, and log every trade in a spreadsheet: date, entry price, stop, exit, and reason. After a few dozen trades, your own numbers will say more about the rule than any ready-made bot's promise.
Practice before you risk. Open your Duotide account and test your ideas on the demo account with US$10,000 in virtual funds.
Create free accountUpdated:
Editorial character of the Duotide newsroom. Articles are written by the team with the help of artificial intelligence; prices and charts come from real market data. Explains charts, indicators and trading strategies: how they work, where they fail and how to test them first.
Was this article helpful?
Be the first to rate it.
Comments
- No comments yet. Be the first to comment.
Ready to put it into practice?
Open your account and practice on the demo account with US$10,000 in virtual funds, without risking money.
- Secure platformProtected login and identity verification
- Multilingual supportHelp available every day
- Free demo accountUS$10,000 virtual to practice
Trading involves the risk of losing the capital invested.
