

 Português pt
 Español es
 العربية ar
 বাংলা bn
 Deutsch de
 Filipino fil
 Français fr
 हिन्दी hi
 Bahasa Indonesia id
 Italiano it
 Русский ru
 Svenska sv
 ไทย th
 Türkçe tr
 Tiếng Việt vi
 简体中文 zh
Updated:
IndicatorsIchimoku Cloud: What It Is, How to Calculate and Use It
 Naomi TanakaEditorial character · Analysis Desk

Quick answer
The Ichimoku cloud is a trend indicator made of five lines calculated from midpoints between the highs and lows of 9, 26, and 52 periods. Price above the cloud signals a bullish bias; below, bearish; inside, no clear direction. The crossover between the Tenkan-sen and the Kijun-sen works as a strength signal, but it only carries weight when it agrees with where the price sits relative to the cloud.
Created by Japanese journalist Goichi Hosoda, who began developing it in the 1930s and published it in the late 1960s, the Ichimoku cloud brings trend, momentum, and support and resistance zones together in a single drawing. The full name, Ichimoku Kinko Hyo, is usually translated as a one-glance equilibrium chart.
The several lines look intimidating at first, but they all come from the same simple math. In this guide we use gold's real daily quotes (GC=F futures contract, Yahoo Finance data) between March and October 2026 to calculate each component and show what the indicator actually signaled.
What the Ichimoku Cloud Is
It's a set of five lines calculated from midpoints between the highs and lows of different periods. Unlike a regular moving average, which uses closes, Ichimoku uses the halfway point between the highest and lowest point of each window:
- Tenkan-sen (conversion line): (highest high + lowest low of the last 9 periods) ÷ 2.
- Kijun-sen (base line): (highest high + lowest low of the last 26 periods) ÷ 2.
- Senkou Span A: (Tenkan-sen + Kijun-sen) ÷ 2, plotted 26 periods ahead.
- Senkou Span B: (highest high + lowest low of the last 52 periods) ÷ 2, also plotted 26 periods ahead.
- Chikou Span: the current close, plotted 26 periods back.
The area between the two Senkou Spans is the cloud, or kumo. Since it's projected forward, the cloud that appears under today's candle was calculated using data from 26 sessions ago.

How to Calculate the Ichimoku Cloud
Let's calculate the indicator for gold on the 08/10/2026 session, when the contract closed at $4,419.70.
The Day's Tenkan-sen and Kijun-sen
- Last 9 sessions (07/29 to 08/10): high of $4,453.80 (08/10) and low of $3,993.80 (07/29). Tenkan-sen = (4,453.80 + 3,993.80) ÷ 2 = 4,223.80.
- Last 26 sessions (07/06 to 08/10): high of $4,453.80 and low of $3,963.00 (07/17). Kijun-sen = (4,453.80 + 3,963.00) ÷ 2 = 4,208.40.
The Cloud Under the 08/10 Candle
This day's cloud comes from the 07/02 values, 26 sessions earlier:
- Tenkan-sen on 07/02: (4,238.10 + 3,955.40) ÷ 2 = 4,096.75. Kijun-sen on 07/02: (4,627.10 + 3,955.40) ÷ 2 = 4,291.25.
- Senkou Span A = (4,096.75 + 4,291.25) ÷ 2 = 4,194.00.
- Senkou Span B: 52 sessions through 07/02, with a high of $4,854.80 (04/21) and a low of $3,955.40 (06/30). (4,854.80 + 3,955.40) ÷ 2 = 4,405.10.
Result: the cloud ran from 4,194.00 to 4,405.10, and the $4,419.70 close sat above its top. The Tenkan-sen was also above the Kijun-sen. Since Span B was above Span A, the cloud was still bearish, a combination that's common right after a turn. Some platforms shift the cloud 25 periods instead of 26, which changes the values slightly.
Real Example: Gold's Ichimoku in 2026
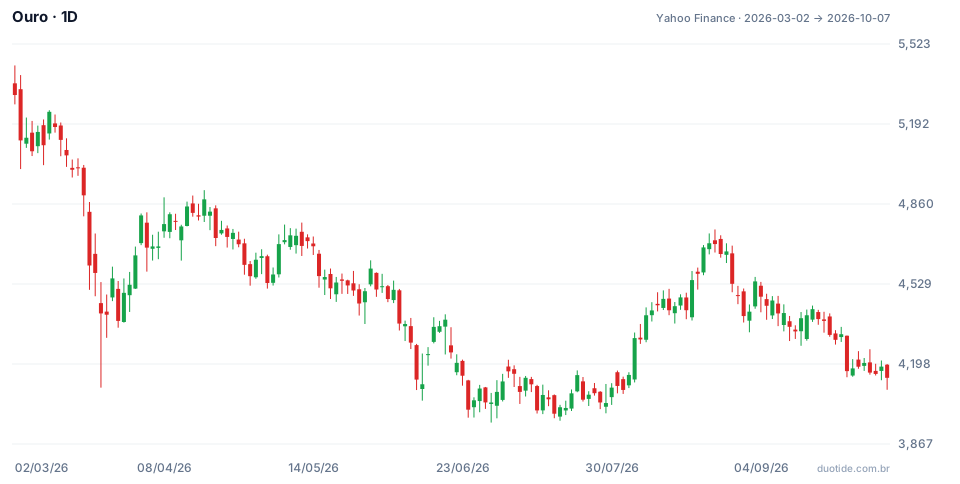
The chart shows gold's daily candles over the period; the Ichimoku lines were calculated from this same data. Three moments help show what the indicator does and doesn't do:
March to August: Price Below the Cloud
Gold closed 03/02 at $5,311.60, above the cloud. By 03/19 it closed at $4,605.70, already below it, after a 13.3% drop. The price stayed below or inside the cloud until early August and marked the period's low on 06/30, at $3,955.40. Along the way, on 04/13, the Tenkan-sen crossed above the Kijun-sen with gold at $4,767.40, but the crossover happened below the cloud: by 06/01 the price was at $4,506.30, 5.5% lower. A bullish crossover against the cloud is a weak signal.
August 10: a Cloud Breakout
This is the day from the calculation above: a close at $4,419.70, above the cloud's top (4,405.10). Ten sessions later, on 08/24, gold closed at $4,697.80, 6.3% higher. Notice the breakout's narrow margin, just $14.60: a breakout by a slim margin doesn't guarantee it will hold, and anyone entering there needed a defined stop.
September: a Bearish Crossover and a Drop Back Below the Cloud
On 09/11 the Tenkan-sen crossed below the Kijun-sen with the price at $4,408.90. On 09/24 gold entered the cloud and, on 09/28, closed below it, at $4,168.40. By 10/07 it was at $4,140.70, 6.1% below the crossover day. The bearish crossover came before the loss of the cloud and served as a warning.

How to Use the Ichimoku Cloud
Price Position Relative to the Cloud
Above the cloud, the bias is bullish; below, bearish; inside, the market has no clear direction. It's the simplest reading, and the one that filters the others.
Cloud Color and Thickness
Span A above Span B forms a bullish cloud; the opposite forms a bearish one. A thick cloud usually works as a support or resistance zone that's harder to break; a thin cloud breaks more easily.
The Tenkan-sen vs. Kijun-sen Crossover
It works like a moving-average crossover: the fast line above the slow one signals buying strength. The signal carries more weight when it happens on the same side of the cloud as the price, as the false April crossover showed.
Kijun-sen as a Stop Reference
Many traders use the Kijun-sen as an exit level. On 08/10, it stood at 4,208.40: a stop just below it would represent a risk of about $211 per ounce from the close.
Limitations
Ichimoku is calculated only from past prices and lags during sharp turns. In a sideways market, the price moves in and out of the cloud several times and the crossovers repeat without direction. It's five lines to read at once, which makes it easy to see the signal you want to see.
Common Mistakes When Using the Ichimoku Cloud
- Trading the Tenkan x Kijun crossover without checking where the price sits relative to the cloud.
- Forgetting that today's cloud was calculated using data from 26 sessions ago.
- Treating a breakout by a few dollars as strong confirmation.
- Using the indicator in a sideways market, where the signals cancel each other out.
- Changing the 9, 26, and 52 parameters without testing the effect first.
- Forgetting that the examples above describe what happened, not what will happen.
To practice, open an asset's daily chart in a demo account, add Ichimoku with the default parameters, and note, over a few weeks, every cloud breakout and every crossover, along with the day's price and the price ten sessions later. Your own record will show in which conditions the indicator worked and in which it didn't.
Practice before you risk. Open your Duotide account and test your ideas on the demo account with US$10,000 in virtual funds.
Create free accountUpdated:
Editorial character of the Duotide newsroom. Articles are written by the team with the help of artificial intelligence; prices and charts come from real market data. Explains charts, indicators and trading strategies: how they work, where they fail and how to test them first.
Was this article helpful?
Be the first to rate it.
Comments
- No comments yet. Be the first to comment.
Ready to put it into practice?
Open your account and practice on the demo account with US$10,000 in virtual funds, without risking money.
- Secure platformProtected login and identity verification
- Multilingual supportHelp available every day
- Free demo accountUS$10,000 virtual to practice
Trading involves the risk of losing the capital invested.
