

 Português pt
 Español es
 العربية ar
 বাংলা bn
 Deutsch de
 Filipino fil
 Français fr
 हिन्दी hi
 Bahasa Indonesia id
 Italiano it
 Русский ru
 Svenska sv
 ไทย th
 Türkçe tr
 Tiếng Việt vi
 简体中文 zh
Updated:
IndicatorsKDJ Indicator: What It Is and How It Differs from the Stochastic Oscillator
 Naomi TanakaEditorial character · Analysis Desk

Quick answer
The KDJ is a variation of the stochastic oscillator with three lines: K and D, smoothed versions of the stochastic, and J, calculated as 3K − 2D. The J line amplifies the distance between K and D, can go above 100 or below 0, and tends to turn before the others. Above 80 it indicates overbought, and below 20, oversold, without guaranteeing a reversal.
Anyone who already uses the stochastic oscillator knows the logic: comparing the close with the range between the recent high and low. The KDJ starts from that exact base, smooths the lines a different way, and adds a third one, the J line, which reacts before the others. It's widely used in the Chinese stock market and shows up today on most charting platforms.
In this article we calculate the KDJ with real daily quotes for the British pound against the dollar (GBP/USD) between April and October 2026 and compare its signals with the traditional stochastic's over the same period.
What the KDJ indicator is
The KDJ has three lines, all derived from the RSV, which is the same calculation as the stochastic's fast %K: the close's position within the range of the last N periods, from 0 to 100.
- K line: a smoothed average of the RSV. In the regular stochastic, the fast %K is the RSV itself; in the KDJ, it already comes smoothed.
- D line: a smoothed average of the K line, slower still.
- J line: 3K − 2D. It measures how far K has drifted from D and amplifies that distance. Because of that, it can go above 100 or fall below 0.
That third line is the practical difference from the stochastic. It works as an early warning: it tends to turn before the K-D crossover.

How to calculate the KDJ
With the default (9, 3, 3) setting:
- RSV = (close − low of 9 periods) ÷ (high of 9 − low of 9) × 100
- K = 2/3 × previous K + 1/3 × RSV
- D = 2/3 × previous D + 1/3 × K
- J = 3 × K − 2 × D
Example with GBP/USD on October 7, 2026
Over the 9 sessions through October 7, the high was 1.33067 and the low, 1.31822. The close was 1.32668. The day before, K was at 26.06 and D at 22.33. The math uses unrounded values; redoing it with the displayed numbers, the last digit may differ.
- RSV = (1.32668 − 1.31822) ÷ (1.33067 − 1.31822) × 100 = 67.96
- K = 2/3 × 26.06 + 1/3 × 67.96 = 17.37 + 22.65 = 40.03
- D = 2/3 × 22.33 + 1/3 × 40.03 = 14.89 + 13.34 = 28.23
- J = 3 × 40.03 − 2 × 28.23 = 63.62
Notice the difference: the 9-period fast stochastic would read 67.96 that day, the RSV itself. The KDJ's smoothed K sits at 40.03. The J line, at 63.62, falls between the two and shows the recent days' upward momentum is gaining strength.
Real example: KDJ and the stochastic on GBP/USD in 2026
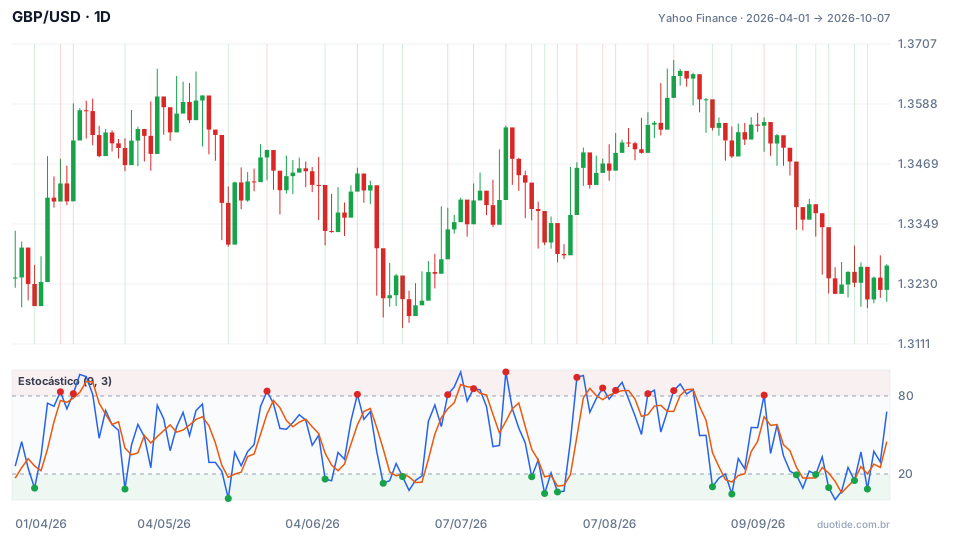
The chart shows GBP/USD with the traditional 9-period stochastic: the blue line is the fast %K (the RSV) and the orange one, its 3-period average. The pair ended the period almost where it started, with a high of 1.3675 on August 21 and a low of 1.3143 on June 24. We calculated the KDJ on the same quotes.
Fewer extreme signals than the stochastic
Over the period, the stochastic's %K crossed above 80 or below 20 on 29 occasions. The KDJ's J line went above 100 or fell below 0 on only 8. All three KDJ lines above 80 at the same time never happened on any of the 136 sessions; all three below 20 at the same time, on 4. K's smoothing makes the KDJ far more selective than the fast stochastic in the extreme zones.
July: the J line near the bottom
On July 28, with the pair at 1.3290, the J line fell to −5.8, while K was at 19.3 and D at 31.9. Ten sessions later, GBP/USD was at 1.3511, up 1.67%, and kept rising up to the period's high on August 21. The stochastic was also oversold that day (6.17), but it had already given similar signals on July 22 and July 24.
September: an early warning that failed
On September 2, with the pair at 1.3515, J came in slightly below zero (−0.2), one day before the stochastic's %K fell below 20. Ten sessions later, the price was 0.31% lower, and the drop continued down to 1.3211 on September 25, when J turned negative again. The early signal came too soon: the pair was starting a correction, not ending one.
K and D crossovers
Of the 22 K-D crossovers with ten sessions of history afterward, price moved in the crossover's direction in 11, exactly half. On a pair that ended the period flat, the crossover alone offered no edge.

How to use the KDJ
Overbought and oversold
All three lines above 80 indicate overbought; below 20, oversold. Since that's rare on the KDJ, when it happens the move is usually very stretched. Even so, it's not an automatic reversal signal.
J line as a warning
J above 100 or below 0 warns that K has drifted far from D. Use it as a cue to watch price closely, not as an order.
K and D crossover
K crossing above D is read as a buy signal; below, a sell signal. It works better in the direction of the larger trend and near support and resistance.
Limitations
The KDJ inherits the stochastic's problems: in a strong trend, it stays at the extremes for a long time, and in a sideways market it generates directionless crossovers. The J line, being amplified, also amplifies the noise. The smoothing's starting value shifts the numbers slightly between platforms at the beginning of the series.
Common mistakes when using the KDJ
- Thinking the KDJ is just the stochastic with an extra line: K already comes smoothed and gives different readings.
- Trading every pass of J above 100 or below 0 as a sure reversal.
- Ignoring the trend and trading K-D crossovers against it.
- Comparing KDJ values between platforms without checking the setting and the smoothing method.
- Forgetting that the GBP/USD examples describe what happened, not what will happen.
To practice, put the KDJ and the stochastic on the same chart on a demo account and log, over a few weeks, every extreme signal from both, with that day's price and the price ten periods later. Comparing the two records shows whether the J line adds anything to your method.
Practice before you risk. Open your Duotide account and test your ideas on the demo account with US$10,000 in virtual funds.
Create free accountUpdated:
Editorial character of the Duotide newsroom. Articles are written by the team with the help of artificial intelligence; prices and charts come from real market data. Explains charts, indicators and trading strategies: how they work, where they fail and how to test them first.
Was this article helpful?
Be the first to rate it.
Comments
- No comments yet. Be the first to comment.
Ready to put it into practice?
Open your account and practice on the demo account with US$10,000 in virtual funds, without risking money.
- Secure platformProtected login and identity verification
- Multilingual supportHelp available every day
- Free demo accountUS$10,000 virtual to practice
Trading involves the risk of losing the capital invested.
