

 Português pt
 Español es
 العربية ar
 বাংলা bn
 Deutsch de
 Filipino fil
 Français fr
 हिन्दी hi
 Bahasa Indonesia id
 Italiano it
 Русский ru
 Svenska sv
 ไทย th
 Türkçe tr
 Tiếng Việt vi
 简体中文 zh
Updated:
IndicatorsKDJ Indicator: How to Customize the Settings
 Naomi TanakaEditorial character · Analysis Desk

Quick answer
The KDJ uses three parameters: the high-low window's period (default 9) and two smoothing periods for the K and D lines (default 3 and 3). Shorter periods make the indicator faster and generate more false signals; longer ones make it slower and more stable. The best setting depends on your trading timeframe and should be tested before use.
The KDJ comes on most platforms set to 9, 3, 3, and most people never touch it. But those three numbers decide how many signals the indicator generates, how early they show up, and how many will be false. Adjusting them to your trading timeframe is one of the simplest and most useful changes you can make.
In this article we use real daily quotes for bitcoin (BTC/USDT on Binance) between April and October 2026 to calculate the KDJ and compare, with numbers, what happens when the main period is swapped.
What the K, D, and J lines are
The KDJ is born from the stochastic oscillator. First the RSV is calculated, which shows where the close sits within the range between the high and the low of the last N periods, on a scale from 0 to 100. From there:
- K: a smoothed average of the RSV.
- D: a smoothed average of the K line, slower still.
- J: 3 × K − 2 × D. It amplifies the distance between K and D and, because of that, can go above 100 or below 0, something the regular stochastic doesn't do.

How to calculate the KDJ and what each number controls
With the (N, M1, M2) = (9, 3, 3) setting:
- RSV = (close − low of N periods) ÷ (high of N − low of N) × 100. N sets the window size.
- K = previous K × (M1 − 1) ÷ M1 + RSV ÷ M1. With M1 = 3, yesterday's K line carries 2/3 of the weight and today's RSV, 1/3.
- D = previous D × (M2 − 1) ÷ M2 + K ÷ M2.
- J = 3K − 2D.
Example with bitcoin on October 7, 2026
Over the 9 days through October 7, the high was $87,220.00 and the low, $82,775.94. The close was $83,321.81. The day before, K was at 62.78 and D at 58.02. The math uses unrounded values; redoing it with the displayed numbers, the last digit may differ.
- RSV = (83,321.81 − 82,775.94) ÷ (87,220.00 − 82,775.94) × 100 = 545.87 ÷ 4,444.06 × 100 = 12.28
- K = 62.78 × 2/3 + 12.28 × 1/3 = 41.85 + 4.09 = 45.95
- D = 58.02 × 2/3 + 45.95 × 1/3 = 38.68 + 15.32 = 53.99
- J = 3 × 45.95 − 2 × 53.99 = 29.85
The close near the window's low dragged the RSV down to 12.28, but the smoothing held K at 45.95. The K line crossed below D that day, and J, the fastest one, was already at 29.85.
Real example: the effect of settings on bitcoin
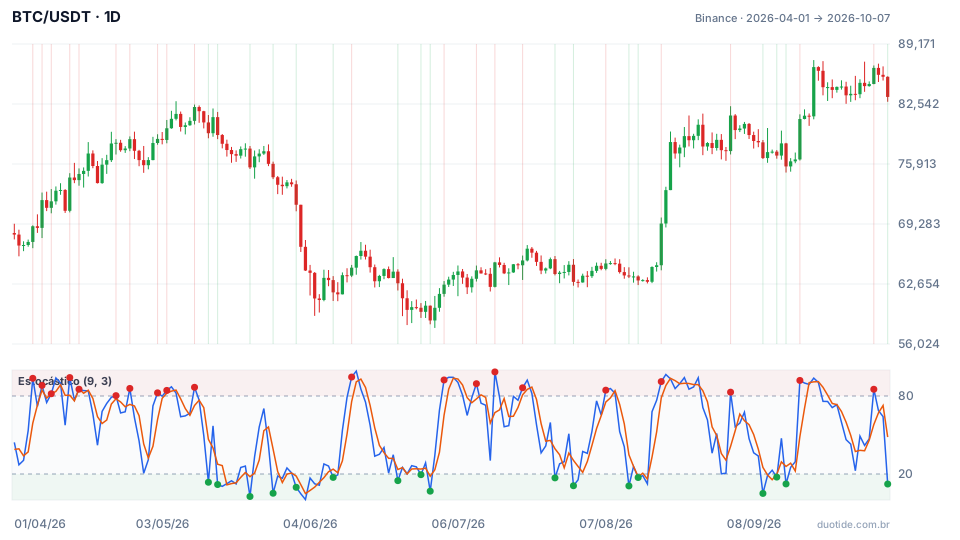
The chart shows bitcoin with the 9-period stochastic. The blue line is the RSV, the KDJ's raw material; the orange one is its 3-period average. The KDJ's K and D are smoothed versions of these lines. Over the period BTC rose from $68,113.92 to $83,321.81, with a low of $57,800.19 on July 1 and a high of $87,395.67 on September 21.
How many signals each period generates
We counted the crossovers between K and D between April and October, keeping M1 and M2 at 3:
- N = 5: 41 crossovers
- N = 9 (default): 33 crossovers
- N = 14: 24 crossovers
- N = 21: 26 crossovers
Shortening the window from 9 to 5 increased signals by about 24%. Lengthening it to 14 cut more than a quarter (from 33 to 24). From 14 to 21 the count barely changed: past a certain point, lengthening the period slows the indicator down without cutting the number of crossovers much further.
J above 100 in an uptrend
With the default setting, the J line went above 100 six times. In five of them, the price was higher ten days later: on April 7 (from $71,924.22 to $77,072.00, +7.2%) and on August 20 (from $73,025.15 to $77,682.00, +6.4%), for example. Only on June 13 did the price fall, 2.7%. In a rising market, J above 100 showed strength, not exhaustion.
The short period catches what the default misses
On August 12, with BTC at $63,479.99, the J line on the 5, 3, 3 setting fell below zero. The default setting didn't give the same warning that day. Ten days later the price was at $77,074.93, up 21.4%. The short period also got it wrong: on May 17, J below zero (with BTC at $77,457.67) was followed by a 3.9% drop.

How to customize the KDJ for your style
Faster: N between 5 and 6
For very short trades, where getting in early matters more than avoiding noise. Expect more signals and more false ones, as shown by the count of 41 crossovers.
Balanced: 9, 3, 3
The default works as a starting point for 1-hour to daily charts on liquid assets.
More stable: N between 14 and 21
For swing trading and positions held for days or weeks. Signals arrive later, but there are fewer of them.
Adjusting M1 and M2
Increasing M1 and M2 (to 5, for example) smooths K and D and reduces crossovers without changing the price window. Lowering them to 2 makes the lines jumpier. Change one parameter at a time to know what caused the difference.
Limitations
No setting eliminates every oscillator's basic problem: in a strong trend, it stays at the extremes for a long time. And a setting that worked on an asset's past may not work on its future, or on a different asset.
Common mistakes when customizing the KDJ
- Tweaking the parameters until they "nail" a specific chart's past signals.
- Changing N, M1, and M2 at the same time and not knowing which change made the difference.
- Using a short period on a short timeframe and being surprised by the number of false signals.
- Treating J above 100 or below 0 as a buy or sell order, without looking at the trend.
- Forgetting that bitcoin's numbers describe what happened, not what will happen.
To practice, put two KDJs on the same chart on a demo account, one with 9, 3, 3 and another with the period you want to test, and log, over a few weeks, each one's signals and what price did afterward. The right setting is the one that works in your own record, not the one that shows up in ready-made lists.
Practice before you risk. Open your Duotide account and test your ideas on the demo account with US$10,000 in virtual funds.
Create free accountUpdated:
Editorial character of the Duotide newsroom. Articles are written by the team with the help of artificial intelligence; prices and charts come from real market data. Explains charts, indicators and trading strategies: how they work, where they fail and how to test them first.
Was this article helpful?
Be the first to rate it.
Comments
- No comments yet. Be the first to comment.
Ready to put it into practice?
Open your account and practice on the demo account with US$10,000 in virtual funds, without risking money.
- Secure platformProtected login and identity verification
- Multilingual supportHelp available every day
- Free demo accountUS$10,000 virtual to practice
Trading involves the risk of losing the capital invested.
