

 Português pt
 Español es
 العربية ar
 বাংলা bn
 Deutsch de
 Filipino fil
 Français fr
 हिन्दी hi
 Bahasa Indonesia id
 Italiano it
 Русский ru
 Svenska sv
 ไทย th
 Türkçe tr
 Tiếng Việt vi
 简体中文 zh
Updated:
Technical analysisLiquidity Sweep or Breakout: How to Tell Them Apart Before Entering
 Naomi TanakaEditorial character · Analysis Desk

Quick answer
A liquidity sweep is when price pushes past a recent high or low, triggers the orders stacked there, and returns inside the range; a breakout is when price gets accepted on the other side of the level and stays there. The difference shows up in where the candle closes and, above all, in the candles that follow: in a breakout, the broken level holds on pullbacks; in a sweep, the price can't reclaim it.
A wick that pokes above a resistance and comes back inside the range on the same candle doesn't say much on its own. It could be the start of a real breakout or just a liquidity sweep: price touches an obvious level, triggers the orders stacked there, and pulls back. Trying to label the move while the candle is still forming tends to lead to premature entries.
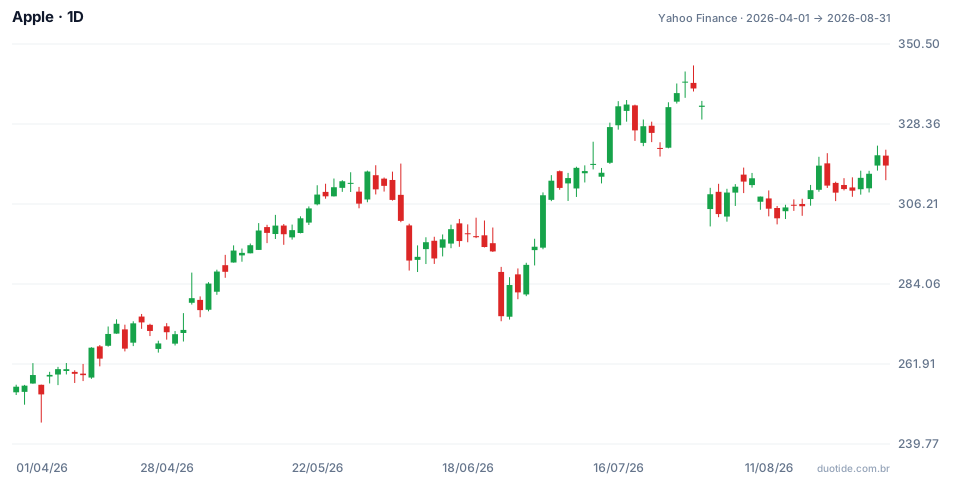
In this guide, instead of made-up examples, we use real daily prices for Apple (AAPL, Yahoo Finance data) from April to August 2026. The period has the three cases that confuse people the most: a wick that looked like a sweep and turned into a breakout, a bearish breakout that closed outside the range and then failed, and a classic sweep at the top.
What a liquidity sweep is and what a breakout is
Above a recent high, stop orders from short sellers and buy orders from traders wanting to catch the breakout pile up. Below a recent low, the mirror image happens. These clusters of orders are the liquidity the name refers to.
- Liquidity sweep: price pushes past the level, triggers those orders, and finds no follow-through. The candle closes back inside the range and the following candles can't reclaim the level.
- Breakout: price pushes past the level and gets accepted on the other side. It closes outside the range, the following pullbacks are shallow, and the broken level starts acting as support (on a bullish breakout) or resistance (on a bearish one).
The difference lies in the reaction after the level is touched, not in the size of the wick.

How to measure the reference level
To avoid relying on hand-drawn lines, an objective approach is to use the high and low of the last 20 sessions. For Apple, the high of the 20 sessions before July 29, 2026 was $342.89, set on July 28. On July 29, the day's high was $344.57, or $1.68 above the level (0.49%). The close, however, was $338.19, $4.70 below the level. By the closing criterion, that's a sweep, not a breakout.
For volume, compare the day's volume with the average of the previous 20 sessions. On July 29 it was 56.1 million shares against an average of 50.0 million: 1.12 times the average, practically a normal day.
Real example: three Apple cases in 2026
April 30 and May 1: looked like a sweep, turned into a breakout
On April 30, Apple touched $276.00, above the high of the previous 20 sessions ($275.77), and closed at $271.35, back inside the range. Volume was 91.8 million shares, 2.25 times the average. Anyone reading only that candle would call it a sweep. The next day, May 1, the stock opened at $278.86, already above the level, and closed at $280.14. On the May 4 pullback, the low was $274.86 and the close $276.83: the old $276 ceiling held as support. By May 15 the stock was closing at $300.23. The isolated candle was misleading; the following candles settled the question.
June 25: a close outside the range that didn't hold
On June 25, Apple dropped to $275.15, closing well below the low of the previous 20 sessions ($287.38), with 107 million shares traded, double the average. By the closing and volume criteria, this was a bearish breakout. Except that by June 30 the price was already closing at $289.36, back above the broken level, and on July 10, ten sessions later, it was at $315.32, 14.6% above the June 25 close. This case shows that even a close outside the range isn't enough: when the price moves back inside in the following days, the breakout reading loses its validity.
July 29: a classic sweep at the top
After posting consecutive highs on July 27 and 28, Apple rose to $344.57 on July 29 and closed at $338.19, below the $342.89 level, with volume of just 1.12 times the average. On July 30 it closed at $333.43, with no attempt to reclaim the level. On July 31 it opened at $304.81 and closed at $308.91. On August 12, ten sessions after the wick, the close was $302.25, 10.6% below July 29. A close back inside, ordinary volume, and an immediate failure to retake the level: all three checks pointed to a sweep.
These three cases describe what happened with this stock over this period, not a rule that the same thing will repeat.

How to use the five checks
1. Where the candle closed
On an upward move, a close back below resistance favors a sweep reading; a close comfortably above favors a breakout reading. A close in the middle of a wide zone doesn't say much. Treat support and resistance as zones, not an exact price, and wait for the candle to close on the time frame you trade.
2. What happens right after
The following candles matter more than the breakout itself. After a real breakout, price stays outside the range, the pullback is shallow, and the broken level holds, as on May 4. After a sweep, price moves back inside and the next attempt to reclaim the level fails, as on July 30.
3. Where the move happens
A bullish breakout within a broader uptrend, with room to run before the next relevant resistance, has a better chance of continuing than the same move sitting just below a weekly resistance. In a market that has already failed several times on both sides of a range, the next wick outside it tends to be a rejection until proven otherwise.
4. Was there real participation
Compare the candle's volume with the recent average and check whether the candle's range expanded. The July 29 wick came on normal volume; the May 1 breakout came with 1.84 times the average. But the June 25 case shows that high volume also accompanies moves that fail. In forex, where there's no centralized volume, use this figure only as a local reference.
5. Where the idea would be wrong
Before entering, define the invalidation point. On a breakout, the idea loses strength if the price closes back inside the old range. On a trade against a sweep, the idea loses strength if the price reclaims the level and goes past the wick's extreme. Compare that distance with the room to a realistic target: if confirmation took so long that the target is close and the stop is far, let it go.
Limitations
None of the checks is definitive at the moment of decision: the sweep or breakout label usually only becomes clear after a few candles. Gaps, like the one on July 31 in Apple, jump over stops and make the loss bigger than planned. And the 20-session window is a convention; other periods change which candles count as a test.
Common mistakes when telling sweeps and breakouts apart
- Entering the breakout while the candle is still open, before knowing where it closes.
- Concluding there was a sweep based only on the size of the wick, without waiting for the following candles.
- Treating a close outside the range as definitive confirmation, as the June 25 case showed.
- Using volume as the only decision criterion.
- Marking the level as an exact price instead of a zone.
- Entering without first defining the point where the read would be wrong.
- Forcing a label when the price crosses the same level back and forth repeatedly: waiting is also a decision.
To practice without risking money, open the daily chart of the asset you follow on a demo account, mark the high and low of the last 20 sessions, and note, for every test of those levels, where the candle closed, the volume, and what the price did over the following five sessions. After a few dozen cases, your own log will show how often each reading held up on that asset.
Practice before you risk. Open your Duotide account and test your ideas on the demo account with US$10,000 in virtual funds.
Create free accountUpdated:
Editorial character of the Duotide newsroom. Articles are written by the team with the help of artificial intelligence; prices and charts come from real market data. Explains charts, indicators and trading strategies: how they work, where they fail and how to test them first.
Was this article helpful?
Be the first to rate it.
Comments
- No comments yet. Be the first to comment.
Ready to put it into practice?
Open your account and practice on the demo account with US$10,000 in virtual funds, without risking money.
- Secure platformProtected login and identity verification
- Multilingual supportHelp available every day
- Free demo accountUS$10,000 virtual to practice
Trading involves the risk of losing the capital invested.
