

 Português pt
 Español es
 العربية ar
 বাংলা bn
 Deutsch de
 Filipino fil
 Français fr
 हिन्दी hi
 Bahasa Indonesia id
 Italiano it
 Русский ru
 Svenska sv
 ไทย th
 Türkçe tr
 Tiếng Việt vi
 简体中文 zh
Updated:
IndicatorsMarket Sentiment: What It Is and What Tools to Use
 Naomi TanakaEditorial character · Analysis Desk

Quick answer
Market sentiment is the collective mood of participants, from fear to euphoria, and it can be measured with tools like the VIX, the put/call ratio, volume, OBV, and positioning reports. It's most useful at the extremes, read in a contrarian way and with price confirmation, and it doesn't point to turning-point dates.
Not every price move is born from a clear fundamental. Often, what moves an asset is the collective mood of its participants: optimism, fear, greed, or panic, to varying degrees. This is what's called market sentiment, and learning to measure it complements technical and fundamental analysis.
In this guide, we explain the main sentiment tools and use the SPY's real daily quotes and volume, the fund that tracks the S&P 500, between March and October 2026, to show how volume and the OBV captured the fear and the calm of the period.
What market sentiment is
Sentiment is the prevailing disposition of participants toward an asset or the market as a whole. When most people are optimistic and have already bought, there are few people left to keep buying. When most people are fearful and have already sold, selling pressure tends to run out. That's why sentiment is usually read in a contrarian way at the extremes: widespread euphoria calls for caution, widespread panic calls for attention to a possible reversal.
In between, though, sentiment tends to follow the trend. A rally with moderate, growing optimism is normal and can last a long time.

Tools for measuring sentiment
Volatility index (VIX)
Calculated from S&P 500 options prices, it measures the volatility the market expects over the next 30 days. It rises with fear and falls with calm, which is why it earned the nickname fear index.
Put/call ratio
It compares the volume of put options (used for protection) with the volume of call options. High values indicate a search for protection; low values indicate confidence or complacency.
Volume and OBV
High volume on declines often marks panic and forced liquidation. The OBV (on-balance volume) adds up the volume on up days and subtracts the volume on down days, showing whether volume is confirming the price move or not.
Positioning and surveys
Positioning reports on large futures participants, such as the COT in the United States, investor opinion surveys, and composite fear-and-greed indexes sum up the overall mood. In crypto, the funding rate on perpetual contracts shows whether leveraged buyers or sellers are paying to hold their position.
How to calculate the OBV
The rule is simple, day by day:
- If the close was higher than the previous day's, add that day's volume to the OBV.
- If it was lower, subtract that day's volume.
- If it was the same, keep the OBV unchanged.
The OBV's absolute value depends on where the sum started and means nothing on its own. What matters is the direction: OBV rising along with the price shows volume confirming the rally; price rising with OBV falling shows a rally with less participation.

Real example: SPY's volume and OBV in 2026
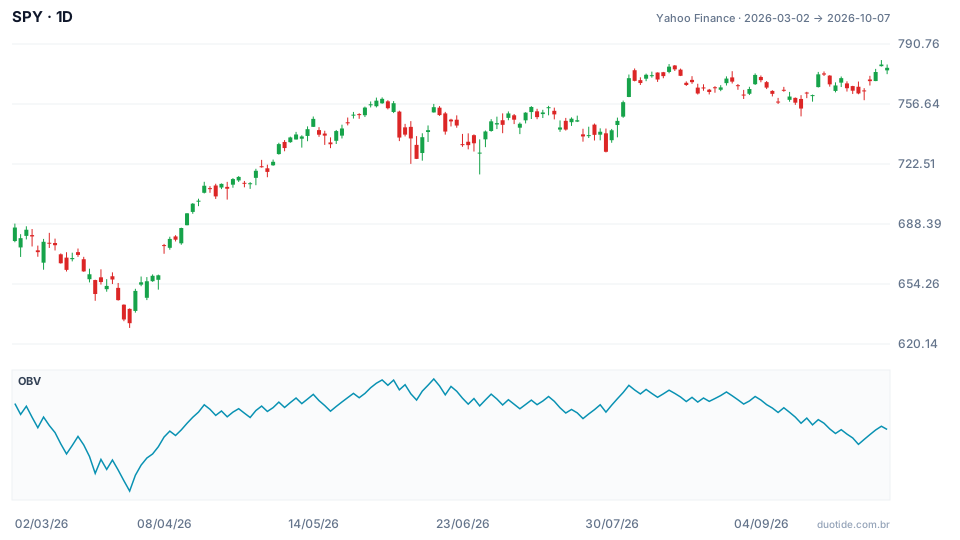
The chart shows the SPY from March to October 2026 and, in the panel below, the OBV. The fund rose 13.2% over the period, from $686.38 to $777.22. Three moments show the sentiment captured in the volume:
March: fear in the volume
SPY fell from $686.38 on March 2 to $631.97 on March 30, a 7.9% drop, with a low of $629.28 that day. March's average daily volume was 101.7 million shares, more than double May's 47.3 million. The OBV reached its lowest point of the period on March 30. Ten sessions later, on April 14, SPY was at $694.46, up 9.9%. The extreme volume showed up near the bottom, which only became clear afterward.
June: volume confirming the rally
Between April and mid-June, the price and the OBV rose together. The OBV reached its highest value of the period on June 15, with SPY at $754.83. In this phase, sentiment was following the trend, with no extremes.
September and October: higher price, lower OBV
On October 6, SPY closed at $779.09, the highest close of the period and 3.2% above June 15. The OBV, however, was well below June's peak, and August's average volume (39.7 million) was the lowest in the window. That's a divergence: the price rose with less volume on up days than on down days. It points to lower participation in the rally, not a date for a drop. What comes next isn't on the chart yet.
How to use market sentiment
Read the extremes in a contrarian way
Extreme fear, like March's volume, and extreme euphoria deserve attention to a possible reversal. Intermediate readings don't say much on their own.
Wait for price confirmation
Extreme sentiment can get even more extreme. Before acting, wait for the price to show a reaction: a higher low, a break of a nearby resistance, a change in the sequence of candles.
Combine different sources
Volume, implied volatility, and positioning measure different things. When several of them point to the same extreme, the reading becomes more reliable than with just one.
Use it as a filter, not a trigger
Sentiment helps decide when to be more cautious or more aggressive with position size. The entry timing still comes from your strategy.
Limitations
Sentiment indicators don't give you dates. The market can stay euphoric for months, and fear can last longer than seems reasonable. Volume is also affected by technical factors: on March 20, 2026, SPY had the period's highest volume, 163.6 million shares, on a quarterly options and futures expiration day in the United States. And survey and positioning data arrive with a delay.
Common mistakes when using market sentiment
- Trading against the trend just because sentiment looks too optimistic.
- Treating a volume divergence as a scheduled date for a drop.
- Reading the OBV's absolute value instead of its direction.
- Using a single sentiment source and ignoring the rest.
- Confusing technical volume spikes, like expirations, with panic.
- Forgetting that the examples above describe what happened, not what will happen.
To practice without risking money, open the daily chart of an index or fund in a demo account, add volume and the OBV, and over a few weeks note the days with volume well above average and what the price did afterward. Your record will show how much sentiment helps your reading of the market.
Practice before you risk. Open your Duotide account and test your ideas on the demo account with US$10,000 in virtual funds.
Create free accountUpdated:
Editorial character of the Duotide newsroom. Articles are written by the team with the help of artificial intelligence; prices and charts come from real market data. Explains charts, indicators and trading strategies: how they work, where they fail and how to test them first.
Was this article helpful?
Be the first to rate it.
Comments
- No comments yet. Be the first to comment.
Ready to put it into practice?
Open your account and practice on the demo account with US$10,000 in virtual funds, without risking money.
- Secure platformProtected login and identity verification
- Multilingual supportHelp available every day
- Free demo accountUS$10,000 virtual to practice
Trading involves the risk of losing the capital invested.
