

 Português pt
 Español es
 العربية ar
 বাংলা bn
 Deutsch de
 Filipino fil
 Français fr
 हिन्दी hi
 Bahasa Indonesia id
 Italiano it
 Русский ru
 Svenska sv
 ไทย th
 Türkçe tr
 Tiếng Việt vi
 简体中文 zh
Updated:
PsychologyMarket Sentiment: Mass Psychology in Trading
 Camila NascimentoEditorial character · Risk & Behavior Desk

Quick answer
Market sentiment is participants' collective mood toward an asset, optimistic or pessimistic. When fear or euphoria take over, herd behavior pushes the price beyond what the fundamentals explain, and the worst moments to act tend to be exactly the ones with the most pressure to act. Volume well above average combined with an extreme price move is an objective way to spot those moments.
Prices don't move on their own: they're the result of thousands of decisions made at the same time, many of them guided more by emotion than by analysis. When those emotions line up, the move gains a momentum of its own, and that's when collective behavior weighs more than any earnings figure.
To show how this shows up on the chart, we use real daily ether quotes (ETH/USDT on Binance) between April and October 2026, a period with one clear episode of panic and another of euphoria.
What Market Sentiment Is
Market sentiment is the predominant attitude of participants toward an asset at a given moment: optimism, which drives buying, or pessimism, which drives selling. It doesn't measure value, it measures willingness. That's why it can detach from the fundamentals for weeks, pushing the price far above what the numbers would justify in a rally, or far below in a decline.

Why Mass Psychology Happens
People feel safer doing what the group does. In the market, that becomes herd behavior: buying because everyone is buying and the price only goes up, or selling because everyone is selling and the decline seems to have no end. Two fears feed that move:
- Fear of missing out, common after fast rallies: anyone on the sidelines feels they need to get in right now, often near the move's exhaustion point.
- Fear of losing more, common after sharp declines: anyone holding sells to stop the pain, often near the point of greatest pessimism.
Both have something in common: the decision is made by looking at what the price just did, not at what the plan said.
Real Example: Panic and Euphoria in Ether in 2026
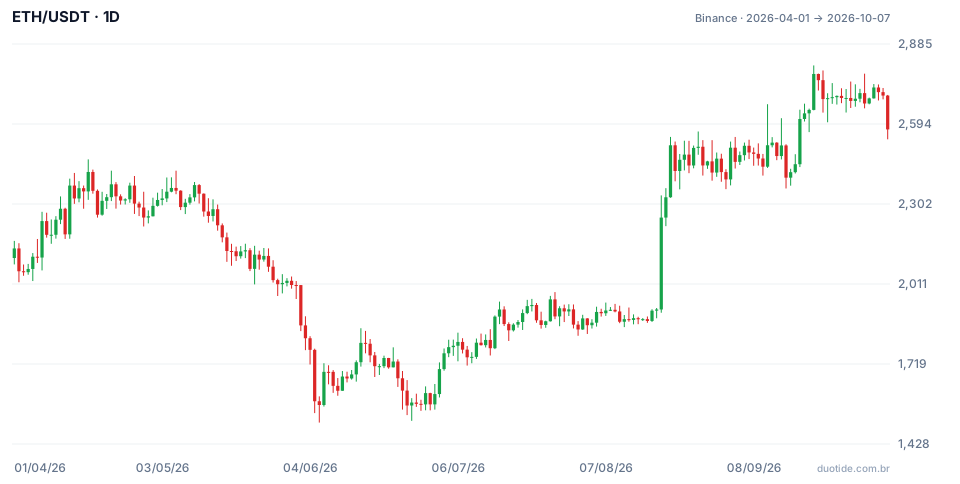
In the chart above, ETH started the window at $2,140.35 (April 1) and closed on October 7 at $2,574.14, a 20.27% gain. Along the way, the low was $1,505.68 on June 6 and the high, $2,807.34 on September 21. An objective way to spot collective emotion is to compare the day's volume with the average of the previous 20 days: when it tops two or three times the average alongside a sharp price move, a lot of people are deciding at the same time.
June: The Panic
Between June 1 ($2,006.73) and June 5 ($1,583.40), ether fell 21.1% in four trading days. On June 5 alone the drop was 10.58%, with volume 4.24 times the average of the previous 20 days. The next day the price touched $1,505.68, the period's low. Anyone who sold at the peak of the panic, at the June 5 close, saw the price rise 7.70% just by June 7 and be 12.77% higher a month later, on July 5 ($1,785.65). On June 26 there was a new test of the region, with a low of $1,512, and it held.
That doesn't mean buying into panic is always right. Anyone who bought at the June 2 close ($1,859.84), the first day of the sharp drop, still saw the price fall another 19% to the low. The point is different: the moment selling felt most urgent was, in this case, one of the worst moments to actually do it.
August: The Euphoria
On August 19, ETH rose 17.46% in a single day, from $1,917.85 to $2,252.80, with volume 5.23 times the 20-day average. Over three trading days, from August 18 to August 21, the rally reached 31.2%, up to the close of $2,516.30. Anyone who entered at that close, pushed by the feeling of missing the move, was down 4.94% by September 2 ($2,391.92) and still 2.74% below it on September 17 ($2,447.28). The price spent almost a month moving sideways before heading up again.
September and October: The Most Recent Top
ETH closed on September 21 at $2,776.19, after touching $2,807.34 that day. On October 7 it was at $2,574.14, 7.28% lower, with a 4.57% drop on that last day alone. These examples describe what happened; they don't say what happens next.

How to Use Sentiment in Your Favor
Measure It, Instead of Feeling It
Volume well above average together with an extreme price move, unanimous headlines, and social media talking about nothing but one asset are more reliable thermometers than your mood of the day. Note the relative volume on days of strong moves and compare it later with what the price did.
Use Sentiment as a Filter, Not a Trigger
Trading against extreme sentiment (buying into pessimism, reducing a position into euphoria) is a well-known idea, but the extreme can last longer than seems reasonable, as the decline from June 2 to June 6 shows. The more balanced use is as context: if your analysis already points to a reversal, extreme sentiment in the opposite direction reinforces the read. On its own, it rarely justifies a trade.
Protect Yourself from Your Own Herd
The bigger risk isn't other people's behavior, it's realizing too late that you're being carried along by it. A plan written before the trade, with entry, stop, and target, and stop orders already placed, keeps a decision made calmly from being undone in the heat of the moment.
Limitations
There's no perfect measure of sentiment. High volume can be a legitimate reassessment because of relevant news, not pure emotion. Fear-and-greed indexes and opinion surveys also lag and change methodology over time. Treat any thermometer as a clue, never as proof.
Common Mistakes About Market Sentiment
- Buying after a double-digit rally just because everyone is talking about the asset.
- Selling on the day of the biggest drop and highest volume, without a plan, just to make the pain stop.
- Becoming a contrarian out of habit and betting against every rally or every decline.
- Confusing relevant news with noise and reacting to every headline.
- Changing the stop or the position size in the middle of an emotional move.
To train, use a demo account and keep a journal: for each trade, note what you felt when entering (fear of missing out, fear of losing, calm), the day's relative volume, and the result. Within a few weeks, the records will show which emotional state leads you to your worst decisions.
Practice before you risk. Open your Duotide account and test your ideas on the demo account with US$10,000 in virtual funds.
Create free accountUpdated:
Editorial character of the Duotide newsroom. Articles are written by the team with the help of artificial intelligence; prices and charts come from real market data. Writes about risk management, position sizing and the psychology behind traders' decisions.
Was this article helpful?
Be the first to rate it.
Comments
- No comments yet. Be the first to comment.
Ready to put it into practice?
Open your account and practice on the demo account with US$10,000 in virtual funds, without risking money.
- Secure platformProtected login and identity verification
- Multilingual supportHelp available every day
- Free demo accountUS$10,000 virtual to practice
Trading involves the risk of losing the capital invested.
