

 Português pt
 Español es
 العربية ar
 বাংলা bn
 Deutsch de
 Filipino fil
 Français fr
 हिन्दी hi
 Bahasa Indonesia id
 Italiano it
 Русский ru
 Svenska sv
 ไทย th
 Türkçe tr
 Tiếng Việt vi
 简体中文 zh
Updated:
Psychology5 Trading Superstitions: Myth or Fact? Tested With Real Data
 Camila NascimentoEditorial character · Risk & Behavior Desk

Quick answer
Most trading superstitions don't survive an honest count. Round numbers attract orders, but they don't always hold the price; losing streaks don't make the next trade a guaranteed win; the Monday effect swings a lot from year to year; and no indicator is always right. The way forward is to test every belief with data before using it.
Every market has beliefs that get passed down from one generation of traders to the next. Some have a bit of grounding in collective behavior; others survive thanks to confirmation bias, the tendency to remember the times a belief worked and forget the times it failed. The antidote is simple: count.
Instead of offering an opinion, we put five common superstitions to the test with real data: gold's daily quotes (futures contract GC=F) between April and October 2026, and five years of S&P 500 closes, from October 2021 to October 2026, both from Yahoo Finance.
Why superstitions spread in trading
The outcome of a trade mixes decision and luck. When a belief coincides with a gain, it sticks in memory; when it fails, the blame goes somewhere else. Without a record and without counting, any rule can look like it works.

Real example: gold and the US$ 4,000 round number
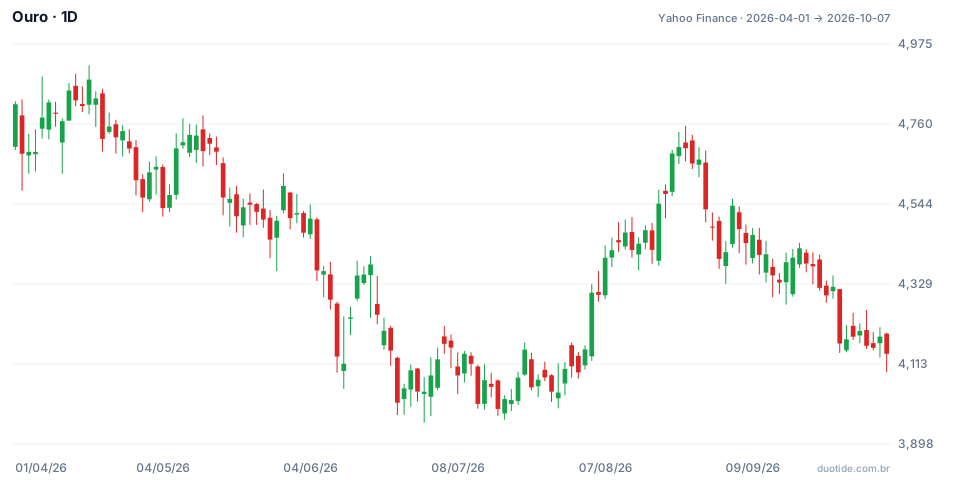
Gold opened the window at US$ 4,813.10 on April 1, 2026, fell to a low of US$ 3,955.40 on June 30, and closed on October 7 at US$ 4,140.70. The chart lets us test the first superstition.
The 5 superstitions, one by one
1. Round numbers are always support or resistance
Between June 24 and July 29, 2026, gold touched US$ 4,000 in 11 sessions, but closed below that level in just one of them: July 16, at US$ 3,992.10. The low was US$ 3,955.40 on June 30, and even then that day's close was US$ 4,038.50. Plenty of people place orders at round numbers, so those levels tend to concentrate buying and selling. But the price traded below US$ 4,000 several times during the day, and a stop placed exactly at US$ 4,000 would have been hit.
Verdict: partly true. Round numbers attract orders, but they don't always hold the price, and a stop parked right on one is an easy target.
2. After five losses in a row, the next trade has to be a win
This is the gambler's fallacy. Over the five years of S&P 500 data, the index rose on 53.2% of 1,253 sessions. After three losing days in a row, it rose the next day in 74 of 123 cases (60.2%). After five losing days in a row, in 11 of 14 cases. There's a slight bounce tendency in the index, but a sample of five losing streaks is too small to draw a conclusion, and in 3 cases the decline continued. Nothing has to happen.
In your own trades, the logic is even clearer: if every trade follows the same rules, five losses in a row don't raise the odds of winning the sixth.
Verdict: myth, and a dangerous one. It leads people to raise their risk right after a bad streak, hoping to make it back.
3. Monday is reversal day
Over the five years of data, the S&P 500 rose on 60.7% of Mondays, versus 53.2% for all sessions. That looks like an effect. But year by year: in 2022 it rose on just 40.0% of Mondays; in 2023, on 75.6%. A pattern that swings that much from one year to the next isn't a reliable rule. And the reversal idea doesn't hold up either: on 112 of 233 Mondays (48.1%), the index moved opposite to the prior session's direction, less than half the time.
Verdict: mostly a myth. Calendar effects do show up in studies, but they're too small and too unstable for a strategy.
4. This indicator never fails
Gold's 14-period RSI gave four extreme-zone signals during the window. On June 10 it entered oversold territory at US$ 4,133.30, and ten sessions later the price was 2.07% lower. On June 24, another oversold reading at US$ 4,008.80, and ten sessions later gold was 3.29% higher. On August 12 it entered overbought territory at US$ 4,467.50 and the price rose another 4.16%. On August 20, another overbought reading at US$ 4,571.40, and the price fell 0.69%. Two signals worked, two didn't.
Verdict: myth. Every indicator fails sometimes; what changes is how often, and how much each failure costs.
5. If everyone is talking about it, it's time to buy
When an asset becomes a hot topic everywhere, it has usually already risen a lot. Jumping in at that point means buying after everyone who got in earlier, and sometimes from people who are selling to you. Sometimes the rally keeps going; other times the chatter marks the peak.
Verdict: myth as a rule. Popularity isn't an entry signal; it's a reason to check things more carefully.

How to test a market belief
Write the rule down
Turn the belief into a testable statement: after X, price does Y within Z days.
Count every case
Use a spreadsheet with historical data and count the hits and the misses, not just the examples you happen to remember.
Compare against the baseline
If the S&P 500 rises on 53% of days, a rule that hits 55% barely adds anything.
Limitations
The tests above use one asset and one period each. Results from another market or another era can differ, and small samples, like the 14 instances of five losses in a row, are easy to be misled by. The numbers describe what happened, not what will happen.
Common mistakes when dealing with superstitions
- Only remembering the cases where the belief worked.
- Increasing position size after a losing streak because a win feels overdue.
- Placing the stop exactly on the round number.
- Drawing conclusions from small samples.
- Buying an asset just because it became a hot topic.
- Giving up on an indicator after one miss, or trusting it blindly after one hit.
Pick a belief you currently rely on, write down the rule, and test it on a demo account, logging every case. If after dozens of entries it doesn't beat the market's normal frequency, it's superstition, and it can leave your process.
Practice before you risk. Open your Duotide account and test your ideas on the demo account with US$10,000 in virtual funds.
Create free accountUpdated:
Editorial character of the Duotide newsroom. Articles are written by the team with the help of artificial intelligence; prices and charts come from real market data. Writes about risk management, position sizing and the psychology behind traders' decisions.
Was this article helpful?
Be the first to rate it.
Comments
- No comments yet. Be the first to comment.
Ready to put it into practice?
Open your account and practice on the demo account with US$10,000 in virtual funds, without risking money.
- Secure platformProtected login and identity verification
- Multilingual supportHelp available every day
- Free demo accountUS$10,000 virtual to practice
Trading involves the risk of losing the capital invested.
