

 Português pt
 Español es
 العربية ar
 বাংলা bn
 Deutsch de
 Filipino fil
 Français fr
 हिन्दी hi
 Bahasa Indonesia id
 Italiano it
 Русский ru
 Svenska sv
 ไทย th
 Türkçe tr
 Tiếng Việt vi
 简体中文 zh
Updated:
IndicatorsThe Moving Average as Dynamic Support and Resistance: How to Use It
 Naomi TanakaEditorial character · Analysis Desk

Quick answer
In clear trends, the moving average often works as support (in an uptrend) or resistance (in a downtrend) that moves along with the price: it pulls back to the line and resumes the move from there. The 21- and 50-period averages are the most used for this. The reading only holds with a defined trend; in a sideways market, the price crosses the average constantly and the signals fail.
Everyone learns that the moving average smooths the price and shows the market's underlying direction. There's a second use, less often explained and very useful for trend followers: treating the average itself as a support or resistance line that moves along with the chart, instead of a fixed level.
In this guide we use real daily prices for Microsoft (Yahoo Finance) from April to October 2026, with the 21-day exponential moving average, to show when the average held the price, when it became resistance, and when it simply stopped working.
What dynamic support and resistance are
A traditional support is a fixed price, marked at an old low. Dynamic support is a line that moves: with every new candle, the average is recalculated and shifts position. In an uptrend, the price tends to pull away from the average, lose steam, pull back until it touches it, and resume climbing. In a downtrend, the mirror happens: the price rises to the average, meets sellers, and falls again.
Why does this happen? Because a lot of people watch the same averages (9, 21, 50, and 200 periods are the most common) and use those points to add to a position in the direction of the trend. The more participants watching the same level, the more it tends to produce a reaction, with no guarantee at all.

How to calculate the 21-day exponential average
The exponential moving average (EMA) gives more weight to recent prices. Each day's formula is: today's EMA = yesterday's EMA + k × (today's close − yesterday's EMA), with k = 2 ÷ (21 + 1) = 0.0909. On October 7, 2026, Microsoft closed at $529.76 and the 21-day EMA stood at $509.12. The price was 4.05% above the average: an uptrend, but without touching the line.
Real example: the 21-day average on Microsoft in 2026
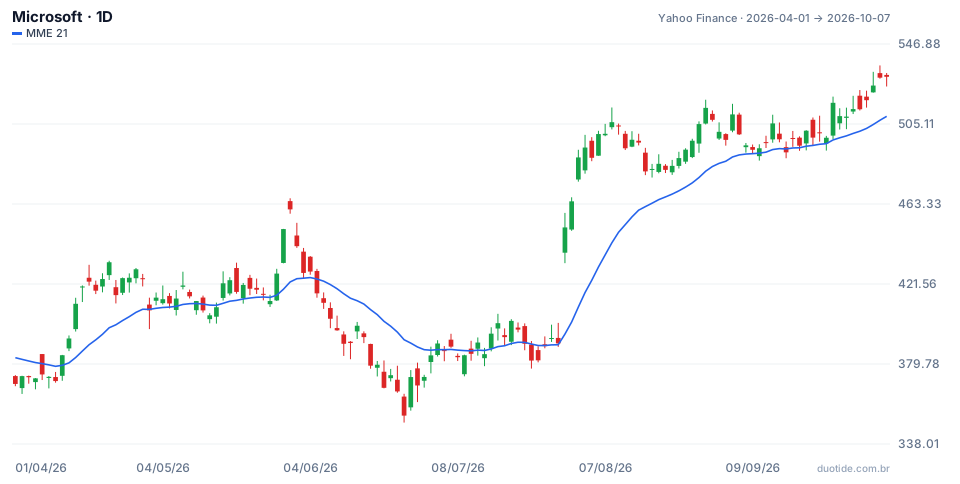
Over the chart's period, the stock went from $369.37 (April 1) to $529.76 (October 7), up 43.42%, with a low of $349.20 on June 25 and a high of $535.69 on October 6. Three moments show the three possible situations.
September: the average as support
After a jump on July 30, when the stock went from $390.54 to $451.10 in a single day (+15.5%), the price got as far as 19% above the average on August 3. It only touched it again in September: between September 8 and 10, the lows were $490.15, $489.80, and $486.00, with the EMA between $489.42 and $489.88, and the closes always stayed above the line. On September 16 there was a close slightly below it ($490.30 versus $492.07), recovered the next day. Anyone buying at the September 11 close, at $495.63, with a stop below the September 10 low, would have risked $9.63 per share (1.9%); on October 7 the stock was at $529.76, 6.9% above the entry.
June: the support that broke
On June 3 and 4, the price touched the average, closing at $427.34 and $428.05 with the EMA near $424.60. On June 5, it closed at $416.67, 1.8% below the line. That wasn't a touch: it was the end of the support. By June 25, the stock had fallen to a low of $349.20, 16.2% below that close.
July: the average as resistance
With the trend turned down, the same line started working as a ceiling. On July 1, the high was $388.83 with the EMA at $386.98, and the close ended up below it. Throughout July the price crossed the average back and forth several times, with no clear direction, until the July 30 jump settled the question.

How to use the average as support and resistance
Confirm the trend first
This use only makes sense with a clear trend: a sloped average and the price sitting mostly on one side of it. Between April and October, Microsoft closed above the 21-day EMA in 91 of 131 sessions; in the trending stretches the reading was useful, in the sideways ones, it wasn't.
Wait for the reaction, not the touch
The touch alone doesn't say anything. In September, the signal was the price closing above the line after touching it; in June, the close below it was the warning.
Use the average to place the stop
In an uptrend, the stop sits a bit below the average or below the low of the touch; in a downtrend, a bit above. That gives an objective rule for the exit.
Choose the period based on your time frame
Traders working on minute charts use short averages, like 9 or 21; those following moves that play out over weeks watch the 50 or the 100. Crossovers between the 50 and 200 averages (the golden cross and the death cross) serve even longer trends and are inherently lagging signals.
Limitations
In a sideways market, the price crosses the average back and forth and every touch generates a false signal, the effect known as a whipsaw, as in July. News-driven jumps, like the one on July 30, also blow straight through any average.
Common mistakes when using the average as support and resistance
- Buying on every touch of the average, even without a defined trend.
- Treating a close below the average as noise and holding the position with no stop, as would have been the case in June.
- Waiting for the price to come back to the average to enter, and missing the move: in August it stayed far from it for a month.
- Using the wrong period for the trade's time frame.
- Forgetting that the examples describe what happened, not what will happen.
To practice, open the daily chart of a trending asset on a demo account, add the 21-period EMA, and log every touch: what the price did in the following days, where the stop would be, and what the result would have been. A few weeks of notes will show whether this reading fits your style.
Practice before you risk. Open your Duotide account and test your ideas on the demo account with US$10,000 in virtual funds.
Create free accountUpdated:
Editorial character of the Duotide newsroom. Articles are written by the team with the help of artificial intelligence; prices and charts come from real market data. Explains charts, indicators and trading strategies: how they work, where they fail and how to test them first.
Was this article helpful?
Be the first to rate it.
Comments
- No comments yet. Be the first to comment.
Ready to put it into practice?
Open your account and practice on the demo account with US$10,000 in virtual funds, without risking money.
- Secure platformProtected login and identity verification
- Multilingual supportHelp available every day
- Free demo accountUS$10,000 virtual to practice
Trading involves the risk of losing the capital invested.
