

 Português pt
 Español es
 العربية ar
 বাংলা bn
 Deutsch de
 Filipino fil
 Français fr
 हिन्दी hi
 Bahasa Indonesia id
 Italiano it
 Русский ru
 Svenska sv
 ไทย th
 Türkçe tr
 Tiếng Việt vi
 简体中文 zh
Updated:
IndicatorsMoving Average: What It Is, How to Calculate and Use It in Trading
 Naomi TanakaEditorial character · Analysis Desk

Quick answer
The moving average is the average of the closing prices over the last N periods, recalculated with every new candle, and it shows the trend's direction without the day-to-day noise. The simple version gives equal weight to every price; the exponential version weighs recent ones more heavily and reacts faster. Price above the average signals a bullish bias, below it a bearish one, but the indicator always lags behind the price.
Few indicators are as widely used, and as widely misunderstood, as the moving average. It's on every charting platform, helps you see the price's direction amid the daily back and forth, and serves as the base for many other indicators, like the MACD and Bollinger Bands. Used without understanding the lag it carries, though, it leads to late decisions.
In this guide we use real daily Ibovespa closes (Yahoo Finance) from March to October 2026 to show how the average is calculated, the difference between the types, and what the signals actually showed.
What the moving average is
The moving average is the average of the closing prices over a set number of periods, recalculated with every new period. A 20-day average shows, on every session, the average of the last 20 closes: the oldest one drops out of the calculation and the most recent one comes in. That's why the line is smoother than the price and shows the prevailing trend.
Simple moving average (SMA)
It gives equal weight to every close in the window. It's the easiest to calculate and understand.
Exponential moving average (EMA)
It gives more weight to recent closes. The formula is: today's EMA = yesterday's EMA + k × (today's close − yesterday's EMA), with k = 2 ÷ (periods + 1). For 20 periods, k = 0.095. It reacts faster to changes in direction, at the cost of being more sensitive to noise.

How to calculate the moving average
The Ibovespa's last five closes through October 7, 2026 were: 187,198 points (October 1), 192,115 (October 2), 206,912 (October 5), 205,835 (October 6), and 204,302 (October 7).
- Sum: 187,198 + 192,115 + 206,912 + 205,835 + 204,302 = 996,362
- 5-day simple average: 996,362 ÷ 5 = 199,272.4 points
- October 7 close (204,302) above the average: a very short-term bullish bias.
With larger windows, the math is the same. On October 7, the 20-day simple average stood at 189,052 points and the 20-day exponential at 190,204. The index had jumped 7.7% between October 2 and October 5, and the exponential, by weighting those days more heavily, was already closer to the price: the close sat 8.1% above the simple average and 7.4% above the exponential.
Real example: the 20- and 50-day averages on the Ibovespa
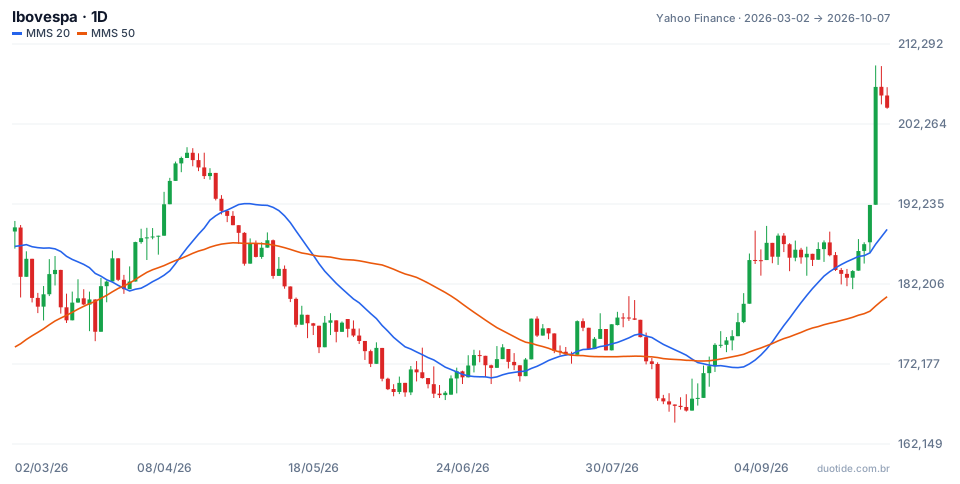
On the chart, the blue line is the 20-day simple average and the orange one is the 50-day. Over the period, the Ibovespa went from 189,307 points (March 2) to 204,302 (October 7), up 7.92%, with a low of 164,835 on August 14 and a high of 209,606 on October 5. The 20- and 50-day averages crossed six times, and the results show the indicator's lag clearly.
April: a bullish crossover near the top
On April 13, the 20-day average crossed above the 50-day, with the index at 198,001 points. Ten sessions later, it was at 188,619, down 4.7%. The crossover arrived after most of April's rally had already happened.
August: a bearish crossover after the bottom
On August 20, the 20-day average crossed below the 50-day, with the index at 167,927 points. The period's low had come six days earlier, on August 14. Ten sessions after the signal, the index was at 185,188, up 10.3%. Anyone selling on the crossover would have gotten out practically at the bottom.
September: a crossover that rode the rally
On September 9, the averages crossed up again, with the index at 185,629 points. On October 7, the Ibovespa was at 204,302, 10.1% higher. This crossover captured the trend; the ones in April and August didn't.

How to use the moving average
To identify the trend
Price above the average with the average sloping up signals an uptrend; the opposite signals a downtrend. It's the simplest and most reliable use. Over the chart's period, the Ibovespa closed above the 20-day average in 75 of 153 sessions, a sign of a market that alternated between up and down phases.
Moving average crossovers
When the short average crosses above the long one, many read it as the start of an uptrend; crossing below, a downtrend. The examples above show that the signal arrives late and works better in long trends than in markets that go back and forth.
Dynamic support and resistance
In clear trends, the price tends to pull back to the average and resume the move from there. The average becomes a reference for entries and for placing the stop.
Choosing the period
Short averages (9, 20) track the short term; the 50-period, the medium term; the 200-period, the long term. There's no single right period: there's the one that fits your trade's time frame.
Limitations
The average is made only of past prices, so it always lags. Jumps like October's leave the line far from the price for days, and in a sideways market the crossovers come one after another with no direction.
Common mistakes when using the moving average
- Trading every moving average crossover as a signal, even in a sideways market.
- Forgetting that the average lags and expecting it to point out the top or the bottom.
- Switching periods until the past chart looks perfect.
- Using the average alone, without looking at support, resistance, and volume.
- Forgetting that the examples describe what happened, not what will happen.
To practice, open the daily chart of an asset you follow on a demo account, add the 20- and 50-period averages, and record every crossover: date, price, and what happened over the following ten sessions. After a few weeks, you'll know how much this signal actually helps on your asset.
Practice before you risk. Open your Duotide account and test your ideas on the demo account with US$10,000 in virtual funds.
Create free accountUpdated:
Editorial character of the Duotide newsroom. Articles are written by the team with the help of artificial intelligence; prices and charts come from real market data. Explains charts, indicators and trading strategies: how they work, where they fail and how to test them first.
Was this article helpful?
Be the first to rate it.
Comments
- No comments yet. Be the first to comment.
Ready to put it into practice?
Open your account and practice on the demo account with US$10,000 in virtual funds, without risking money.
- Secure platformProtected login and identity verification
- Multilingual supportHelp available every day
- Free demo accountUS$10,000 virtual to practice
Trading involves the risk of losing the capital invested.
