

 Português pt
 Español es
 العربية ar
 বাংলা bn
 Deutsch de
 Filipino fil
 Français fr
 हिन्दी hi
 Bahasa Indonesia id
 Italiano it
 Русский ru
 Svenska sv
 ไทย th
 Türkçe tr
 Tiếng Việt vi
 简体中文 zh
Updated:
StocksNvidia, the World's Most Valuable Company: How to Analyze It
 Rafael AzevedoEditorial character · Markets Desk

Quick answer
Being the world's most valuable company shows what the market has already priced in, not what the stock will do next. In 2026, Nvidia rose 25.75% through 10/07, but dropped 19.4% between May and July along the way and swung nearly three times more than the S&P 500. Before any decision, look at volatility, fundamentals, and position size, not the size of the company.
When a company becomes the most valuable in the world, the question changes shape. It stops being whether the company is good and becomes at what price it still makes sense in a portfolio. That's what happened with Nvidia, which in October 2025 became the first company to pass $5 trillion in market value, ahead of giants like Microsoft and Apple.
This article doesn't recommend buying or selling the stock. The idea is to show how to look at a case like this with facts, not headlines. For that, we used Nvidia's real daily quotes (NVDA, Yahoo Finance data) from January to October 2026, compared with the S&P 500 index over the same period.
How Nvidia Got to This Position
The path didn't come from a single product. The company started out selling graphics cards for gaming, moved into parallel computing for data centers, and positioned itself as a core infrastructure supplier for artificial intelligence, combining chips, systems, and software. Along the way, its customer base shifted from individual gamers to large cloud providers and companies that train and run AI models at scale.

What Changes When a Stock Becomes a Market Benchmark
- Weight in indexes: market-cap-weighted indexes, like the S&P 500 and the Nasdaq, start depending heavily on the moves of a single stock.
- Expectations on earnings: the market starts demanding consistent growth every quarter, not just occasional surprises.
- Comparison against itself: the stock starts being measured against its own growth history, on top of its competitors.
The bigger the company, the more future growth is already baked into the price, and the more a quarter that falls short of expectations can weigh on it.
Real Example: Nvidia in 2026
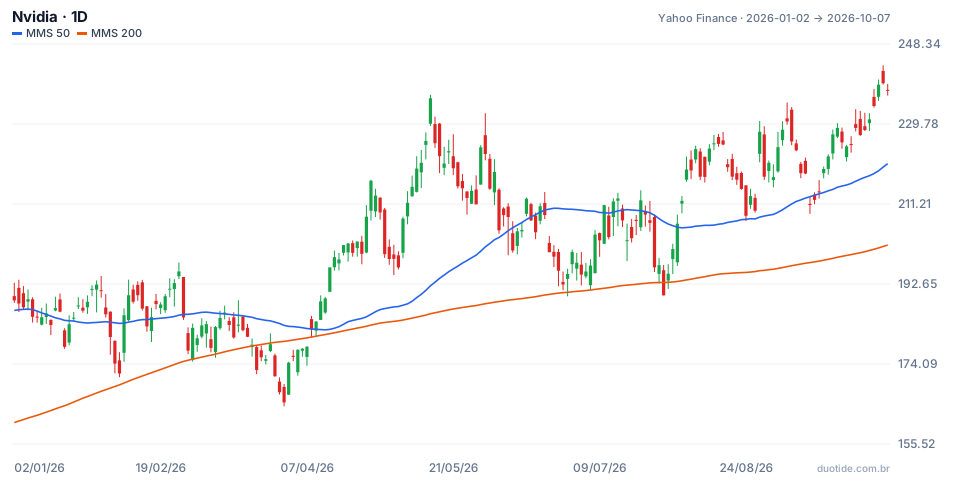
The chart shows the stock's daily candles with the 50-day simple moving average (blue) and the 200-day (orange). The numbers below come from this same data:
The Period's Result
The stock closed 01/02/2026 at $188.85 and 10/07/2026 at $237.47, a 25.75% gain. Over the same period, the S&P 500 rose 13.75% (from 6,858.47 to 7,801.77 points). The window's highest close was on 10/06, at $239.24.
The Path Wasn't a Straight Line
Before the gain came a drop: on 03/30 the stock closed at $165.17, 12.5% below the start of the year. It then climbed to $235.74 on 05/14 and fell again to $190.01 on 07/29, a 19.4% loss in just over two months. Only then came the rally that took the price to October's $237.47, 25% above the July bottom. Anyone who bought in May spent two and a half months underwater before seeing the price come back.
Trend by the Averages
The 50-day average stayed above the 200-day throughout the period, with no crossover at all. Even so, the price closed below the 200-day average on 13 sessions, the first on 03/20 and the last on 07/29. On 10/07, the 50-day average stood at 220.58 and the 200-day at 201.68, with the price above both.

How to Analyze a Stock That Became a Benchmark
Measure Volatility, Not Just the Gain
In 2026, Nvidia's daily move had a standard deviation of 2.39%, against 0.82% for the S&P 500. Annualized, that's about 38% for the stock and 13% for the index. In practice, the stock moved almost three times more than the market. The biggest daily jump was on 08/27 (+8.74%) and the biggest drop, on 06/05 (−6.20%).
Size Your Position by the Worst Recent Scenario
An example with this year's numbers: anyone holding $1,000 in the stock on 05/14 would reach 07/29 with about $806, a $194 loss. If you only accept losing $100 on a move like that, your position should be about half that size. Using the biggest recent drop as a reference helps size the risk before entering.
Look at the Fundamentals the Price Already Embeds
- Whether revenue and profit keep up with the market's expectations.
- How competitors react: high-growth sectors attract new entrants.
- Whether the company depends on a few large customers, which is a concentration risk.
- What valuation multiples say about how much growth is already in the price.
Limitations
The numbers above cover a little over nine months and describe the past. Moving averages lag behind the price, and one year of gains says nothing about the next. Market value also changes every day: the title of most valuable company can change hands with any significant move.
Common Mistakes When Analyzing the World's Biggest Company
- Concluding that a big company is automatically a good buy: size speaks to the past, returns depend on the future.
- Looking only at the year's gain and ignoring the 12% and 19% drops along the way.
- Concentrating a large share of capital in a single stock just because it dominates the headlines.
- Using the same position size as an index on a stock that swings almost three times more.
- Treating market numbers as permanent: they're a snapshot of a moment.
- Forgetting that the examples above describe what happened, not what will happen.
To practice without risking money, follow the stock in a demo account with the 50- and 200-day averages, set how much you're willing to lose before each trade, and note the result. Within a few weeks, your own record will show whether the position size you use matches the asset's real volatility.
Practice before you risk. Open your Duotide account and test your ideas on the demo account with US$10,000 in virtual funds.
Create free accountUpdated:
Editorial character of the Duotide newsroom. Articles are written by the team with the help of artificial intelligence; prices and charts come from real market data. Follows the news that moves prices — rates, stock markets, companies and commodities — explained without jargon.
Was this article helpful?
Be the first to rate it.
Comments
- No comments yet. Be the first to comment.
Ready to put it into practice?
Open your account and practice on the demo account with US$10,000 in virtual funds, without risking money.
- Secure platformProtected login and identity verification
- Multilingual supportHelp available every day
- Free demo accountUS$10,000 virtual to practice
Trading involves the risk of losing the capital invested.
