

 Português pt
 Español es
 العربية ar
 বাংলা bn
 Deutsch de
 Filipino fil
 Français fr
 हिन्दी hi
 Bahasa Indonesia id
 Italiano it
 Русский ru
 Svenska sv
 ไทย th
 Türkçe tr
 Tiếng Việt vi
 简体中文 zh
Updated:
Indicators5 Most Used Technical Indicators and How to Read Each One
 Naomi TanakaEditorial character · Analysis Desk

Quick answer
The five most used technical indicators are moving averages (trend direction), the RSI (strength of the move, from 0 to 100), the MACD (momentum and pace changes), Bollinger Bands (volatility), and volume (participation behind the move). Each one answers a different question, which is why they work better combined, one from each family, than alone or stacked together.
Technical indicators are calculations based on price and volume, plotted on the chart to help you see trend, the strength of a move, and volatility. None of them predicts the future, since they're all derived from past price, but used with judgment they organize the reading and cut down on decisions made purely on visual impression.
Instead of made-up examples, we applied the five most popular indicators to the same asset over the same period: the S&P 500 index, on the daily chart, from April to October 2026. That way you can see what each one actually showed and where they agreed or disagreed.
What technical indicators are
They fall into families. Trend (moving averages) shows direction; momentum (RSI, MACD) shows speed; volatility (Bollinger Bands) shows the size of the swings; and volume shows the participation behind the move. Using one from each family gives you more information than stacking three indicators that measure the same thing.

How to calculate the moving average with real numbers
The 20-period simple moving average adds up the last 20 closes and divides by 20. For the S&P 500, the 20 sessions from September 10 to October 7, 2026 add up to 153,767.26 points. Dividing by 20, the October 7 average is 7,688.36. The index closed the day at 7,801.77, above the average, which reads as a short-term uptrend. The 50-period average, on the same day, stood at 7,680.46.
Real example: the 5 indicators on the S&P 500 in 2026
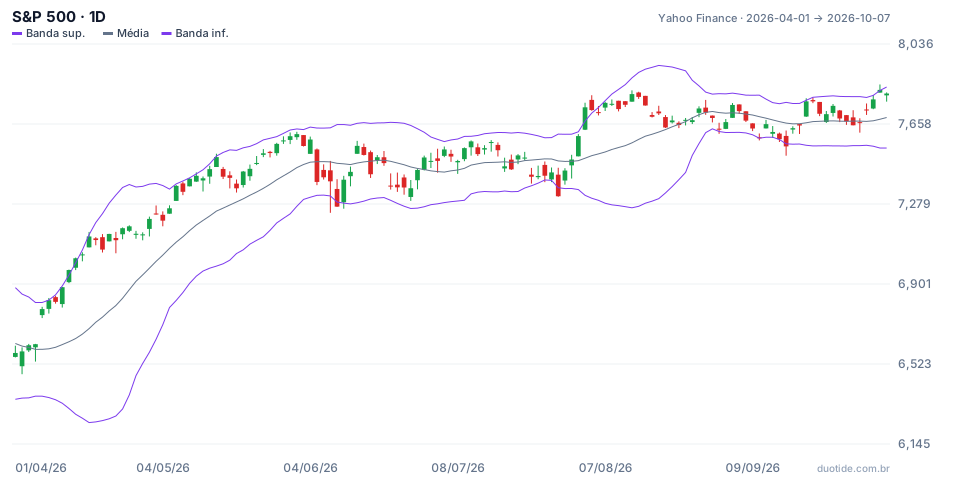
The chart shows the S&P 500 with Bollinger Bands (20 periods, 2 deviations). The index went from 6,575.32 points on April 1 to 7,801.77 on October 7, up 18.65%, with a low of 6,474.94 on April 2 and a high of 7,844.52 on October 6.
1. Moving averages: the April crossover
On April 23, the 20-period average crossed above the 50-period average, with the index at 7,108.40. Ten sessions later it was at 7,337.11, up 3.22%. It was the only crossover between the two averages in the period: in a firm trend, the averages change position rarely. The trade-off is the lag, since the crossover came after the index had already risen more than 500 points since the start of April.
2. RSI: overbought readings that didn't knock the price down
The 14-period RSI passed above 70 six times between April 16 and May 26. The first time, on April 16, the index was at 7,041.28 and ten sessions later at 7,209.01, up 2.38%. In five of the six instances, the price was higher ten sessions later; only the May 26 one (7,519.12) was followed by a drop, of 1.76%. The RSI's peak was 77.71, on May 14. In an uptrend, an RSI above 70 describes strength, not necessarily a top.
3. MACD: sharp at the start, noisy afterward
The MACD (12, 26, 9) crossed above its signal line on April 2, with the index at 6,582.69; ten sessions later, at 7,126.06, up 8.25%. From July on, with the market moving more sideways, there were seven crossovers in three months, almost all followed by small moves. The bearish crossover of September 30 (7,651.54) was followed by a rise of 1.96% instead of a drop.
4. Bollinger Bands: outside the band and the squeeze
On July 29, the index closed at 7,316.15, below the lower band (7,356.35), the same day the RSI marked the period's low, 38.00. Ten sessions later it was at 7,748.50, up 5.91%. The width of the bands, meanwhile, hit its smallest value on August 31, just 2.13% of the average, versus 15.36% on April 23. The squeeze preceded a move but didn't signal its direction: the index first closed below the lower band on September 16 (7,551.81) and then above the upper band on October 6 (7,818.93).
5. Volume: a spike with no direction
The average volume over the last 20 sessions was 5.27 billion shares. The highest volume of the period came on June 26, with 9.11 billion, 1.7 times that average, and the index closed nearly flat (7,354.02, down 0.05%). High volume confirms conviction when it accompanies a breakout; on its own, it can just be portfolio rebalancing or contract expiration.

How to use technical indicators
One from each family
A common combination is a moving average for the trend, RSI or MACD for momentum, and volume for confirmation. On July 29, for example, three independent readings lined up: price outside the lower band, RSI at the period's low, and the index still above its 200-day average (7,015.51), which suggested a pullback within an uptrend rather than a reversal.
Respecting the context
The same signals change meaning depending on the market. In a trend, a high RSI and price at the upper band are normal; in a sideways market, MACD crossovers multiply and lose value. Identify first which of the two scenarios the asset is in.
Adjusting parameters with care
The defaults (20-period average, 14-period RSI, MACD 12-26-9, Bollinger 20-2) are the most used precisely because so many people watch them. Changing them without testing usually just increases the number of signals.
Limitations
All of these indicators are calculated from the same past price, so they tend to agree with each other and lag at sharp turns. None of them accounts for news, earnings, or interest rates. They organize the reading; they don't replace risk management.
Common mistakes when using technical indicators
- Putting five or six indicators on the screen and expecting them all to agree, which freezes any decision.
- Using three indicators from the same family (RSI, stochastic, and CCI, for example) thinking they're independent confirmations.
- Selling just because the RSI passed 70 or because the price touched the upper band, without looking at the trend.
- Trading every MACD crossover in a sideways market.
- Ignoring volume or, the other way around, treating every volume spike as a signal.
- Forgetting that the examples above describe what happened with the S&P 500, not what will happen.
To practice without risking money, pick an asset in a demo account, add a moving average, the RSI, and volume, and record for a few weeks what each one showed before every relevant move. After a few dozen notes, you'll know which readings actually help your style.
Practice before you risk. Open your Duotide account and test your ideas on the demo account with US$10,000 in virtual funds.
Create free accountUpdated:
Editorial character of the Duotide newsroom. Articles are written by the team with the help of artificial intelligence; prices and charts come from real market data. Explains charts, indicators and trading strategies: how they work, where they fail and how to test them first.
Was this article helpful?
Be the first to rate it.
Comments
- No comments yet. Be the first to comment.
Ready to put it into practice?
Open your account and practice on the demo account with US$10,000 in virtual funds, without risking money.
- Secure platformProtected login and identity verification
- Multilingual supportHelp available every day
- Free demo accountUS$10,000 virtual to practice
Trading involves the risk of losing the capital invested.
