

 Português pt
 Español es
 العربية ar
 বাংলা bn
 Deutsch de
 Filipino fil
 Français fr
 हिन्दी hi
 Bahasa Indonesia id
 Italiano it
 Русский ru
 Svenska sv
 ไทย th
 Türkçe tr
 Tiếng Việt vi
 简体中文 zh
Updated:
IndicatorsRainbow Moving Average: What It Is, How to Calculate and Use It
 Naomi TanakaEditorial character · Analysis Desk

Quick answer
The rainbow moving average is a set of several moving averages plotted together, each one a bit slower than the last. When the lines are in order and the fan spreads out, the trend is strong; when they cross and bunch up into a knot, the market has no direction. It's a lagging confirmation indicator: it helps you trade with the trend, not predict when it will start.
Among trend indicators, the rainbow moving average stands out visually: several moving averages plotted together over the price, forming bands that spread apart when the trend gains strength and tangle up when the market loses direction. Set up well, the group really does look like a rainbow over the chart.
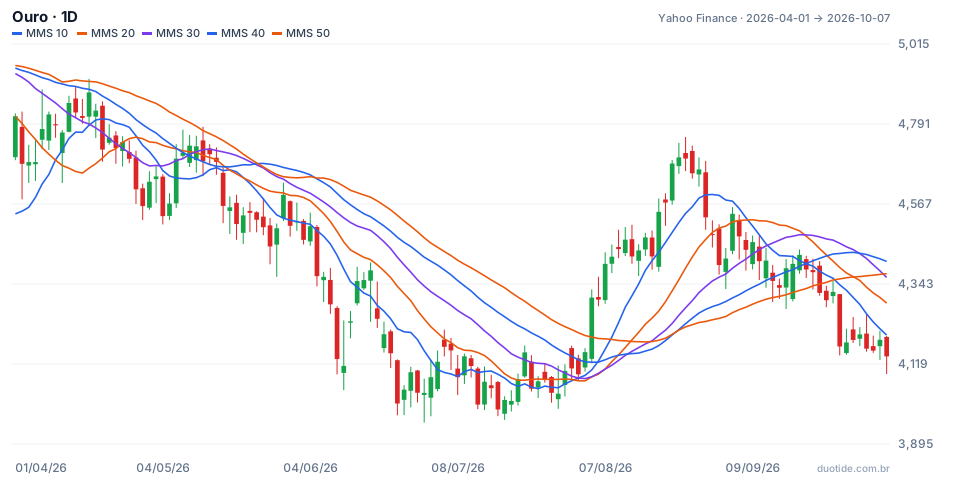
In this guide we use real daily gold prices (the GC=F futures contract, in dollars per ounce, Yahoo Finance data) from April to October 2026 to show how the indicator is calculated and what it showed during the drop, the turn, and the sideways phase.
What the rainbow moving average is
There are two common constructions, and both lead to the same kind of reading:
- Recursive averages: the classic version applies a 2-period average to the price, then another 2-period average to the first one, and repeats the process about ten times. Each line is a bit slower than the one before it.
- Fan of averages: several simple averages with increasing periods, for example 10, 20, 30, 40, and 50. This is the version used in this article's chart, easier to reproduce on any platform.
In both, what matters is the order of the lines (the fastest above all the others in an uptrend, below all of them in a downtrend) and the width of the group (the distance between the fastest and the slowest).

How to calculate the rainbow moving average
Each line is a simple moving average: add up the last N closes and divide by N. For gold's 10-period line on August 24, 2026, the ten closes from August 11 to August 24 were $4,441.10, 4,467.50, 4,420.40, 4,437.30, 4,473.70, 4,420.60, 4,545.30, 4,571.40, 4,680.60, and 4,697.80.
- Sum: $45,155.70
- 10-period average: 45,155.70 ÷ 10 = $4,515.57
- Repeating for 20, 30, 40, and 50 periods: $4,355.26, $4,255.99, $4,215.82, and $4,214.19
- Fan width: 4,515.57 − 4,214.19 = $301.38, or 6.4% of the price
On that day, all five lines were in descending order, from fastest to slowest, and the price was above all of them: the rainbow was fully stacked bullish.
Real example: the rainbow on gold in 2026
June and July: a fan spread out bearish
From June 5 to July 31, all five averages stayed in bearish order without interruption: the 10-period at the bottom, the 50-period on top. Gold went from $4,365.30 on June 5 to $4,107.00 on July 31, and the fan's width reached 8.3% of the price on July 2. Over that stretch, every bounce of the price back up to the averages was followed by a new drop: with the rainbow spread out and ordered, trading against the trend meant going against every line at once.
August: the knot and the turn
On August 3, the order broke down and the lines got tangled up, with the width dropping to 3.1%: that was the knot. On August 5, gold closed at $4,305.20, above all five averages for the first time in the period. The fan only fully flipped to bullish order on August 24, with the price at $4,697.80, 9.1% above August 5. Anyone who waited for full order entered near the top: the move's high was $4,755.00 on August 25, and by August 31 gold was already closing at $4,481.50.
September: the rainbow tangles up again
On September 9, the bullish order broke down. The width fell from 7.8% at the end of August to 0.5% on September 24, when the price closed below all the lines at $4,298.00. On October 7, gold was at $4,140.70, with the averages still tangled: a market with no clear trend by the indicator's reading.
These cases show what happened with gold over this period and aren't meant as a forecast.

How to use the rainbow moving average
The order of the lines
Fully ordered lines, with the fastest at one end and the slowest at the other, indicate an established trend. Lines crossing each other indicate a transition or a sideways market. A lot of traders only trade with the order and stay out when it breaks down.
The fan's width
A fan opening up shows the trend gaining strength. A very wide fan, like the 7.8% at the end of August, shows the price is stretched relative to the slow averages and tends to precede pullbacks or pauses. A narrowing fan warns of weakening strength before the order breaks down.
Price relative to the group
A close above all the lines after a knot, as on August 5, is a faster signal than full order. A close back inside the rainbow is the first warning to exit.
Combining it with other tools
Since the indicator only reads trend, an oscillator like the RSI helps pick entries on pullbacks, and volume helps validate the exit from the knot. Horizontal support and resistance round out the reading.
Limitations
It's made up of several averages, so lag is unavoidable. Full order confirms trends that have already moved a lot, as the August case showed. In markets that switch quickly between trending and sideways, the indicator gets in late and gets out late. It works best on the daily or weekly chart, on assets that tend to sustain trends.
Common mistakes when using the rainbow moving average
- Waiting for the full order of the lines to enter, and buying right when the fan is most stretched.
- Trading inside the knot, when the lines are tangled and the signals contradict each other.
- Putting too many averages on the chart until the reading turns into noise.
- Comparing the fan's width across assets with different volatilities without converting to percentage.
- Using the indicator alone, without support, resistance, and risk management.
- Forgetting that past behavior doesn't guarantee the next move.
To practice without risking money, set up the 10-to-50-period fan of averages on a demo account and record, over a few weeks, every time the rainbow lined up or tangled: date, price, width in percentage, and what the price did over the following ten candles. That's how you find out whether the indicator helps on the asset you follow.
Practice before you risk. Open your Duotide account and test your ideas on the demo account with US$10,000 in virtual funds.
Create free accountUpdated:
Editorial character of the Duotide newsroom. Articles are written by the team with the help of artificial intelligence; prices and charts come from real market data. Explains charts, indicators and trading strategies: how they work, where they fail and how to test them first.
Was this article helpful?
Be the first to rate it.
Comments
- No comments yet. Be the first to comment.
Ready to put it into practice?
Open your account and practice on the demo account with US$10,000 in virtual funds, without risking money.
- Secure platformProtected login and identity verification
- Multilingual supportHelp available every day
- Free demo accountUS$10,000 virtual to practice
Trading involves the risk of losing the capital invested.
