

 Português pt
 Español es
 العربية ar
 বাংলা bn
 Deutsch de
 Filipino fil
 Français fr
 हिन्दी hi
 Bahasa Indonesia id
 Italiano it
 Русский ru
 Svenska sv
 ไทย th
 Türkçe tr
 Tiếng Việt vi
 简体中文 zh
Updated:
StrategiesRSI, SMA, and MACD Strategy: How to Combine the Three
 Naomi TanakaEditorial character · Analysis Desk

Quick answer
The RSI, SMA, and MACD strategy uses each indicator as a filter: the 200 SMA sets the direction, the RSI confirms the momentum (between 50 and 70 for longs), and the MACD crossover gives the entry trigger. The combination cuts down on signals against the trend, but it doesn't eliminate mistakes and sometimes misses the start of a move.
A common mistake for beginners is looking for a single indicator that gives the perfect buy or sell signal. Indicators used alone miss a lot, because each one only sees a slice of the market: one measures trend, another measures speed, another measures exhaustion.
A widely used approach is to combine three tools that complement each other: the simple moving average (SMA), the RSI, and the MACD. In this guide, we build the rules for this combination and apply them to the S&P 500's real daily quotes between March and October 2026, to see which signals the combination let through, which it filtered out, and where it got it wrong.
What each indicator does in the strategy
- 200-period SMA (direction): price above it indicates a long-term uptrend; below it, a downtrend. It's used to decide which side to trade.
- 14-period RSI (momentum): above 50, gains dominate; below it, losses do. Above 70, the move is stretched.
- MACD (12, 26, 9) (trigger): the MACD line crossing above the signal line marks the entry moment; crossing below marks the exit or the short.
The logic is a sequence of filters: the SMA says whether it's worth looking for longs, the RSI says whether the momentum is favorable without being overdone, and the MACD says when to act.

How to build the rules
A simple version for longs, on the daily chart:
- Filter 1: close above the 200 SMA.
- Filter 2: 14-period RSI between 50 and 70.
- Trigger: MACD crosses above the signal line.
- Exit: MACD crosses below the signal line, or a stop below the last low.
For shorts, flip everything. In the stock market, which has an upward bias over the long term, many people use the combination only for longs.
Checking a signal with real numbers
On August 3, 2026, the S&P 500's MACD crossed above the signal line (3.96 versus 0.42). That day, the index closed at 7,600.50 points. The 200 SMA was at 7,028.89, below the price: filter 1 passed. The RSI was at 59.7, between 50 and 70: filter 2 passed. All three agreed, and the entry would be valid under the rules.
Real example: the S&P 500 in 2026
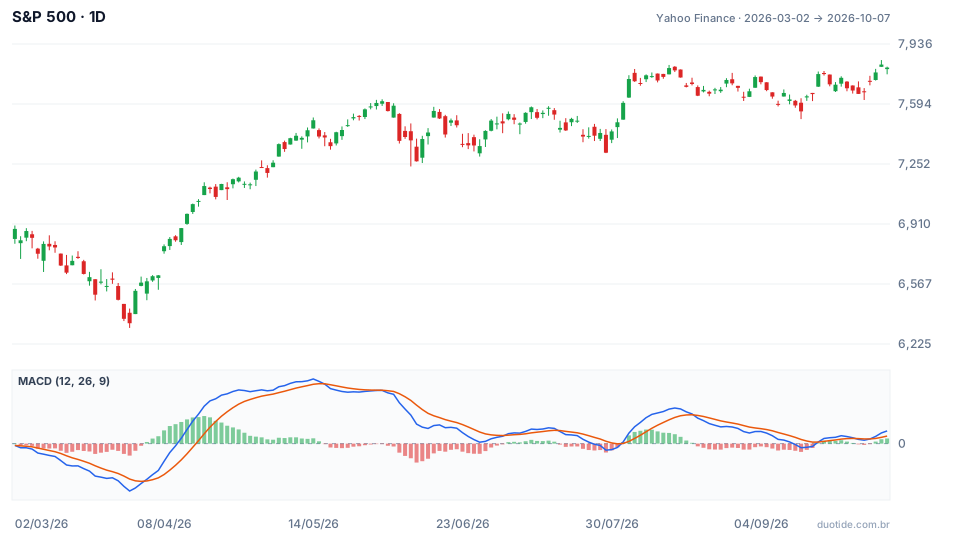
The chart shows the S&P 500 from March to October 2026 and, in the panel below, the MACD with the signal line and the histogram. The index rose 13.4% over the period, from 6,881.62 points to 7,801.77. The MACD crossed the signal line 10 times. Four of them show how the filters behaved:
April 2: the best signal got blocked
The MACD crossed up with the index at 6,582.69 points, and 10 sessions later the price was at 7,126.06, up 8.25%. But the 200 SMA was at 6,644.60, above the price, and the RSI was at 46.2, below 50: both filters rejected the entry. The index only climbed back above the 200 SMA on April 8, by which point the MACD was already above the signal line, with no new crossover. Filters cut down on false signals, but they also cut off the start of some moves.
May 18: the filter avoided a bad short
After the RSI reached 77.7 on May 14, the MACD crossed down on May 18, with the index at 7,403.05. For anyone trading shorts, it was a signal. But the price was well above the 200 SMA (6,785.19), which called for ignoring shorts. Ten sessions later, the index was at 7,609.78, up 2.79%.
July 6: all three filters agreed, and the signal failed
The MACD crossed up with the index at 7,537.43, above the 200 SMA (6,947.56) and with an RSI of 58.4. All the filters passed. The price reached 7,575.39 on July 10, but on July 17 the MACD crossed back down, with the index at 7,457.69, and ten sessions after the entry it was at 7,443.28, down 1.25%. Confluence raises the average quality of signals, it doesn't eliminate the mistakes.
The August 3 crossover, checked above, was followed by a rally: ten sessions later, the index was at 7,745.06, a gain of 1.9%.

How to use the RSI, SMA, and MACD combination
Respect the order of the filters
The 200 SMA comes first because it defines which side to trade. Using the MACD against the long-term trend is what produces the most losing signals, as the May 18 short shows.
Use the RSI to avoid stretched entries
A bullish MACD crossover with the RSI above 70 usually shows up after most of the move has already happened. The 70 threshold isn't magic, but it forces you to ask whether there's still room left.
Test it in more than one market
The indicators work on any price chart, which doesn't mean they work equally well on all of them. Stocks, forex, and crypto have different volatilities and trading hours. Adjust and test before using real money.
Set a stop and a target
The indicators say when to enter; risk management says how much to risk. A stop below the last low and a position size calculated from it are still essential.
Limitations
All three indicators are calculated from the same data, past price. Because of that, agreement between them is less independent than it looks. All of them lag on sharp moves, and in sideways markets the MACD crosses often: between September 21 and October 5, there were three crossovers in two weeks, with the index moving less than 2% between one and the next.
Common mistakes when combining RSI, SMA, and MACD
- Stacking indicators that measure the same thing and thinking the confirmation got stronger.
- Changing the periods after every losing trade to make the past fit.
- Trading MACD crossovers against the 200 SMA.
- Ignoring the RSI above 70 and entering after most of the move has already happened.
- Using the combination without a stop, as if three indicators together couldn't be wrong.
- Forgetting that the examples above describe what happened, not what will happen.
To practice without risking money, open the daily chart of an index in a demo account, add the 200 SMA, the 14-period RSI, and the standard MACD, and note, at every crossover, whether the filters passed and what the price did afterward. After a few dozen records, you'll know whether the combination helps in the market you follow.
Practice before you risk. Open your Duotide account and test your ideas on the demo account with US$10,000 in virtual funds.
Create free accountUpdated:
Editorial character of the Duotide newsroom. Articles are written by the team with the help of artificial intelligence; prices and charts come from real market data. Explains charts, indicators and trading strategies: how they work, where they fail and how to test them first.
Was this article helpful?
Be the first to rate it.
Comments
- No comments yet. Be the first to comment.
Ready to put it into practice?
Open your account and practice on the demo account with US$10,000 in virtual funds, without risking money.
- Secure platformProtected login and identity verification
- Multilingual supportHelp available every day
- Free demo accountUS$10,000 virtual to practice
Trading involves the risk of losing the capital invested.
