

 Português pt
 Español es
 العربية ar
 বাংলা bn
 Deutsch de
 Filipino fil
 Français fr
 हिन्दी hi
 Bahasa Indonesia id
 Italiano it
 Русский ru
 Svenska sv
 ไทย th
 Türkçe tr
 Tiếng Việt vi
 简体中文 zh
Updated:
StocksSemiconductor Sector: How to Analyze the AI Chip Chain
 Rafael AzevedoEditorial character · Markets Desk

Quick answer
The semiconductor sector is a chain of interdependent links: processor design, manufacturing, licensed architecture, memory, and equipment. To analyze it, identify which link the company operates in, track revenue and inventory over several quarters, and measure volatility: in 2026 Micron rose 229.91% from April to June and then fell 39.10% in five weeks.
When people talk about artificial intelligence, attention goes straight to the models and the apps. Behind each one of them sits an entire chain of companies that design, manufacture, equip, and supply memory for the chips that make everything run. Understanding that chain is the first step to reading sector news without falling for the idea that there's a single winner.
This text doesn't recommend buying or selling any stock. The goal is to explain how the links fit together and show, with real daily quotes from 2026, how stocks in the same sector can move at very different paces.
What the semiconductor chain is
A leading-edge AI chip depends on several types of companies at once. The main links are:
- Processor design: companies like Nvidia and AMD design the accelerators used to train and run models in data centers.
- Contract manufacturing: TSMC physically manufactures most of the most advanced chips, designed by other companies.
- Licensed architecture: Arm licenses the base processor design found in billions of phones, cars, and servers.
- Memory: Micron, SK Hynix, and Samsung produce the high-bandwidth memory (HBM) that feeds the accelerators.
- Equipment: ASML is the sole supplier of the EUV lithography machines used in the most advanced processes.
No link works alone. A memory shortage limits how many accelerators can be shipped; an equipment export restriction affects the entire production line. That's why news about one company tends to move several others.

Training, inference, and the engine of the cycle
The first wave of AI, between 2023 and 2024, was driven by training large models, which requires many processors working together. The next stage is inference: running already-trained models for millions of users, cheaply and with low power consumption. That shift tends to favor efficiency, memory, and smaller chips, not just the most powerful accelerators.
The sector is also historically cyclical. Companies invest heavily in capacity when demand rises; when supply catches up with demand, chip prices, especially for memory, can fall fast. Memory tends to be the link most sensitive to this back-and-forth.
How to calculate the drawdown from the peak
A simple way to compare stocks in a volatile sector is the drawdown: how much the price has pulled back from the highest previous close.
- Drawdown = current close ÷ highest previous close − 1
- Micron (MU): highest close on June 25, 2026, $1,213.56; lowest close after that, $739.00 on July 29.
- Drawdown = 739.00 ÷ 1,213.56 − 1 = −39.10%.
- To get back to the peak, the stock would need to rise 1,213.56 ÷ 739.00 − 1 = 64.22%.
The asymmetry is the lesson: a 39% drop requires a 64% gain just to break even. That's why position size matters so much in sectors that swing this hard.

Real example: Micron and the memory cycle in 2026
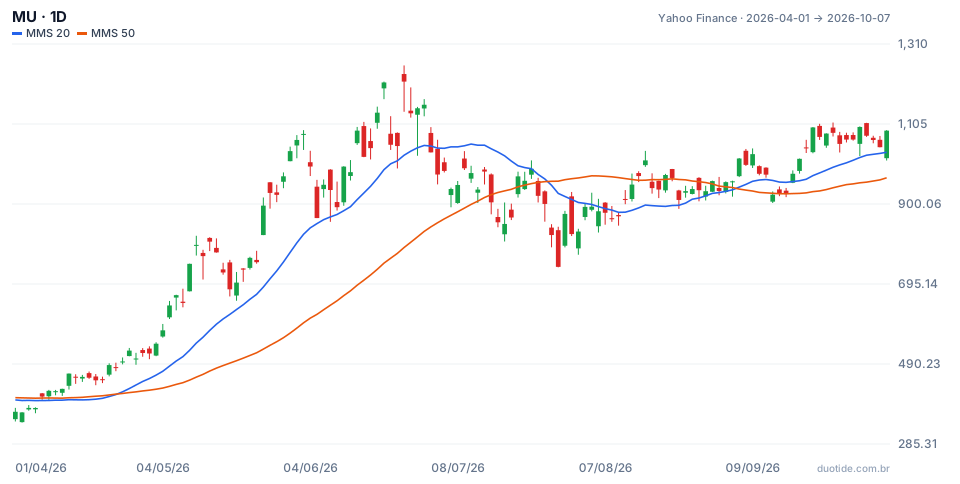
The chart shows Micron's daily price between April and October 2026, with the 20-day and 50-day simple moving averages. Three moments help explain how a cyclical link in the chain behaves.
April to June: a 229.91% rally
The stock closed on April 1 at $367.85 and reached $1,213.56 on June 25, up 229.91% in less than three months. June 25's high was $1,255.00, the highest of the period. Over the same stretch, Nvidia moved quite differently: it closed on June 1 at $224.36 and on June 25 at $195.74, down 12.76%. Two companies in the same chain, moving in opposite directions in the same month.
July: a 39% drop in five weeks
After the peak, Micron closed on July 29 at $739.00, the 39.10% drawdown calculated above. The price closed below the 20-day average on July 1 and below the 50-day on July 15; the 50-day average only reached its highest value of the period, $972.25, on August 5, by which point the price was already at $893.19, below it. Moving averages show the trend with a lag, and in a sector this fast, that lag is significant.
August to October: a partial recovery
On October 7 the stock closed at $1,088.00, 47.23% above July's low, above the 20-day ($1,032.65) and 50-day ($967.16) averages, but still below June's peak. Over the full period, from April 1 to October 7, the rally was 195.77%. AMD rose 207.25% over the same stretch (from $210.21 to $645.86) and Nvidia, 35.12% (from $175.75 to $237.47). The Nasdaq rose 26.09%. These numbers describe what happened, not what will happen.
How to analyze the sector
Identify the link
Before looking at the price, figure out which part of the chain the company operates in. Memory and equipment makers react to the investment cycle; processor designers react to demand from large data center buyers; licensors depend on the volume of devices sold.
Look at several quarters
One quarter of record revenue doesn't define a trend. Compare how revenue and margins evolve over at least four quarters and check whether companies' inventory is growing faster than sales, a classic sign of a cycle turn.
Customer concentration
Some companies in the chain sell a large share of their production to just a few buyers. When one of those customers switches suppliers or delays investments, the effect is large.
Measure volatility before trading
A stock that falls 39% in five weeks calls for a smaller position than a broad index. Size the trade to the stock's typical swing, not to the excitement of the news.
Limitations
Revenue, market share, and market cap figures change every quarter. Any sector number needs to be checked against the most recent date, and chain analysis helps interpret the picture, but it doesn't say when a cycle turns.
Common mistakes when analyzing semiconductors
- Treating the sector as a single block, when each link responds to different forces.
- Buying after a rally of more than 200% assuming the trend is guaranteed.
- Ignoring that memory and equipment are historically the most cyclical links.
- Using the same position size for a chip stock as for a broad index.
- Trusting old revenue or market cap figures without checking the date.
To practice without risking money, follow two or three companies from different links in the chain in a demo account, calculate each one's drawdown from the peak every week, and record how each reacted to the same news. That record shows, better than any stock list, how the sector really behaves.
Practice before you risk. Open your Duotide account and test your ideas on the demo account with US$10,000 in virtual funds.
Create free accountUpdated:
Editorial character of the Duotide newsroom. Articles are written by the team with the help of artificial intelligence; prices and charts come from real market data. Follows the news that moves prices — rates, stock markets, companies and commodities — explained without jargon.
Was this article helpful?
Be the first to rate it.
Comments
- No comments yet. Be the first to comment.
Ready to put it into practice?
Open your account and practice on the demo account with US$10,000 in virtual funds, without risking money.
- Secure platformProtected login and identity verification
- Multilingual supportHelp available every day
- Free demo accountUS$10,000 virtual to practice
Trading involves the risk of losing the capital invested.
