

 Português pt
 Español es
 العربية ar
 বাংলা bn
 Deutsch de
 Filipino fil
 Français fr
 हिन्दी hi
 Bahasa Indonesia id
 Italiano it
 Русский ru
 Svenska sv
 ไทย th
 Türkçe tr
 Tiếng Việt vi
 简体中文 zh
Updated:
StocksSpaceX Stock (SPCX) After the IPO: Valuation and Risks
 Rafael AzevedoEditorial character · Markets Desk

Quick answer
SpaceX debuted on the Nasdaq at $135 a share, raised about $75 billion, and is hard to value because it combines rockets, Starlink, government contracts, and AI, with $18.7 billion in revenue and a loss of almost $5 billion in 2025. The main risks are a valuation that already bakes in a lot of growth, cash burn, and governance: the founder holds about 82.4% of the votes. Through October 7, 2026, SPCX shares were up 24.15% from the IPO, after falling 48.78% from June's peak.
SpaceX stopped being the world's most-watched private company and became a stock traded on the Nasdaq, under the ticker SPCX. For anyone following the stock, the useful question isn't whether the company is interesting, but what's already in the price, what can move it, and which risks are easy to underestimate.
Below are the numbers from the prospectus and the first results, the company's control structure, and a reading of traded volume over the first four months, with real daily data. None of this is a recommendation to buy or sell.
What SpaceX's IPO was
According to the final prospectus filed with the US regulator, Space Exploration Technologies Corp. priced the offering at $135 a share and sold 555,555,555 Class A shares, raising gross proceeds of about $75 billion. On the first trading day, June 12, 2026, the stock opened at $150 and closed at $160.95, up 19.22% from the offering price.

Why the stock is hard to value
The company operates at the same time in reusable rocket launches, satellite internet (Starlink), government and defense contracts, and, after the combination with xAI described in the prospectus, AI infrastructure. Comparisons with aerospace companies don't explain Starlink; comparisons with telecom carriers don't explain the rockets; comparisons with AI companies may be too optimistic while losses and investments stay high.
Scale versus losses
According to the released figures, SpaceX had revenue of $18.7 billion in 2025 and a loss of almost $5 billion. In the first quarter of 2026, combined revenue from the space, connectivity, and AI segments was $4.694 billion, with a pre-tax loss of $4.270 billion. There's scale and rare assets, but also a valuation that already bakes in a good part of the expected success.
Governance: who runs the company
The Class A shares sold to the public carry one vote each; the founder's Class B shares carry ten. After the IPO, he held about 82.4% of the voting power. Anyone buying SPCX shares participates in the economic result, but has practically no influence on decisions. It's a governance risk that belongs in the analysis regardless of whether the company is executing well.
How to calculate the OBV, the volume indicator
Volume shows whether interest in a stock holds up after the debut. One way to track it is the OBV (on-balance volume), created by Joe Granville: a running balance that adds up the volume on up days and subtracts the volume on down days.
- Close above the previous one: today's OBV = yesterday's OBV + today's volume.
- Close below the previous one: today's OBV = yesterday's OBV − today's volume.
- Same close: the OBV doesn't change.
Example with SPCX's first sessions
- June 12: first day, zero base (519.2 million shares traded).
- June 15: closed at $192.50, up, with 256.2 million shares → OBV = 256.2 million.
- June 16: closed at $211.39, up, with 195.4 million shares → OBV = 256.2 + 195.4 = 451.6 million, the highest value of the period.
- June 17: closed at $191.82, down, with 201.7 million shares → OBV = 451.6 − 201.7 = 249.9 million.
The OBV's absolute value doesn't matter; what you read is the direction and the comparison with the price.

Real example: SPCX's volume and OBV through October
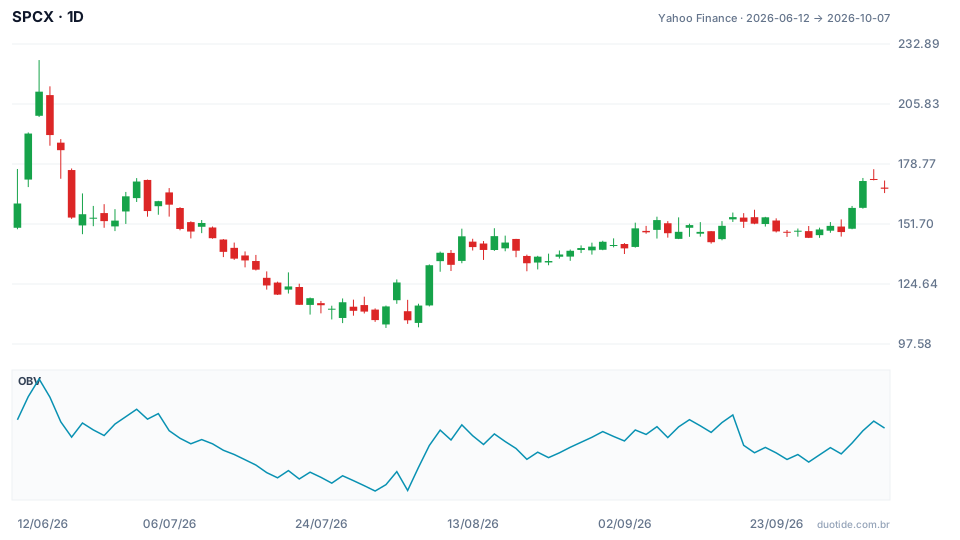
The chart shows SPCX's price and the OBV from June 12 to October 7, 2026. Three readings help explain what happened after the debut.
June and July: volume left the buying side
From the peak of 451.6 million on June 16, the OBV fell to −787.6 million on July 31, with the stock at $108.37. Average daily volume, which was 288.9 million in the first week, fell to 72.4 million in July: attention from the launch cooled off, and volume concentrated on the down days.
August: a bottom with the OBV a bit higher
On August 5 the stock hit the period's lowest close, $108.27, a bit below July 31, but the OBV was at −781.4 million, slightly higher. Right after, on August 7, the stock rose 15.83% on 242.1 million shares, and on August 12 it closed at $146.15, with the OBV at −55.9 million. The difference was too small to be treated as a clear signal; it works as an example of a reading, not as a rule.
September and October: the price recovers more than the volume
On September 18 the stock fell only 1.36%, from $154.81 to $152.71, but on 335.7 million shares, and the OBV lost all of that volume at once. On October 7 the stock closed at $167.60, 24.15% above the IPO, while the OBV was at −91.5 million, far from June's peak. The price recovered more than the volume balance. This data describes what happened, not what will happen.
How to follow SPCX after the IPO
Volume after the euphoria
The real test of a debut is the volume in the following weeks. Compare the monthly average with the first week's and watch whether rallies come with more volume than drops.
Starlink and Starship
Starlink looks like a subscription business and tends to anchor the long-term thesis; Starship milestones and delays move sentiment.
AI costs and the end of the lock-up
AI infrastructure expands the potential and also the cash burn. And the end of lock-up periods for early investors and employees can increase the supply of shares.
Limitations
The OBV treats an entire day's volume as buying or selling based only on the close's sign, so an unusual volume day, like September 18, distorts the series. The prospectus data reflects the moment of the IPO and may have changed since.
Common mistakes with newly listed stocks
- Treating a famous company as a simple trade: fame creates liquidity, it doesn't eliminate risk.
- Entering while chasing the news after most of the move has already happened.
- Ignoring the voting structure and the controlling shareholder's weight.
- Reading a single day's OBV without looking at the trend over several weeks.
- Using IPO numbers as if they were current.
To practice without risking money, add the OBV to SPCX's chart, or another recent debut's, in a demo account, note the direction of price and volume every week, and record what happened in the following weeks. It's the best way to learn to read price discovery without paying for it.
Practice before you risk. Open your Duotide account and test your ideas on the demo account with US$10,000 in virtual funds.
Create free accountUpdated:
Editorial character of the Duotide newsroom. Articles are written by the team with the help of artificial intelligence; prices and charts come from real market data. Follows the news that moves prices — rates, stock markets, companies and commodities — explained without jargon.
Was this article helpful?
Be the first to rate it.
Comments
- No comments yet. Be the first to comment.
Ready to put it into practice?
Open your account and practice on the demo account with US$10,000 in virtual funds, without risking money.
- Secure platformProtected login and identity verification
- Multilingual supportHelp available every day
- Free demo accountUS$10,000 virtual to practice
Trading involves the risk of losing the capital invested.
