

 Português pt
 Español es
 العربية ar
 বাংলা bn
 Deutsch de
 Filipino fil
 Français fr
 हिन्दी hi
 Bahasa Indonesia id
 Italiano it
 Русский ru
 Svenska sv
 ไทย th
 Türkçe tr
 Tiếng Việt vi
 简体中文 zh
Updated:
IndicatorsThe 4 Types of Technical Indicators
 Naomi TanakaEditorial character · Analysis Desk

Quick answer
Technical indicators fall into four families: trend (moving averages, MACD, ADX), momentum (RSI, stochastic), volatility (Bollinger Bands, ATR), and volume (OBV). Each family answers a different question, and using one indicator from each avoids the false confirmation of several indicators measuring the same thing.
There are dozens of technical indicators on any charting platform, and it's common for beginners to get lost trying to memorize formulas instead of understanding what each one is for. Despite the number, almost every indicator fits into one of four families: trend, momentum, volatility, and volume.
Knowing the families helps build a balanced analysis and avoids the mistake of stacking three indicators that measure the same thing. To show each family with real numbers, we use gold's real daily quotes (the COMEX futures contract, in dollars per ounce) between April and October 2026. Over the period, gold went from $4,813.10 to $4,140.70, down 14%, with a low of $3,955.40 on June 30.
What the 4 types of technical indicators are
Trend indicators
They answer which way the market is heading and how consistently. Moving averages are the best-known example: they smooth the price and show the prevailing direction. On October 7, gold's 50-day simple moving average was at $4,372.23, above the $4,140.70 price: a price below the average reads as a downtrend over a horizon of a few months.
The MACD compares two exponential moving averages to show changes in direction. The ADX measures the strength of the trend, not its direction: above 25 usually signals a strong trend; below 20, a directionless market. On July 20, gold's 14-day ADX reached 38.5, the period's highest value, with the negative directional indicator (26.0) well above the positive one (10.3): a strong downtrend. On September 23 it fell to 14.8, the period's lowest, after eight sessions in which gold closed between $4,318.40 and $4,424.90; just a few days later, on September 28, the price closed at $4,168.40. A low ADX shows the absence of a trend, not guaranteed calm.
Momentum indicators
Momentum oscillators measure the speed of price changes and usually swing between fixed limits, like 0 and 100. The RSI is the most used: above 70, overbought; below 30, oversold. The stochastic follows similar logic. On gold, the 14-day RSI reached 25.2 on June 11 and 75.6 on August 24.
Volatility indicators
They measure the size of price swings, without taking a position on direction. Bollinger Bands have a 20-period average in the center and two bands at two standard deviations, which move apart when volatility rises and come closer when it falls. The ATR measures the average daily swing and is widely used to set stops: gold's 14-day ATR went from $196.48 on April 2 to $93.43 on October 7. A $30 stop on gold, with the ATR near $93, would get hit by a single day's normal noise.
Volume indicators
They look at how many trades are behind a move: how many participants are backing that direction? The OBV (on-balance volume) adds up the volume on up days and subtracts the volume on down days. A price at a new high with the OBV rising suggests a sustained move; a price rising with the OBV falling is a divergence.

Real example: Bollinger Bands on gold
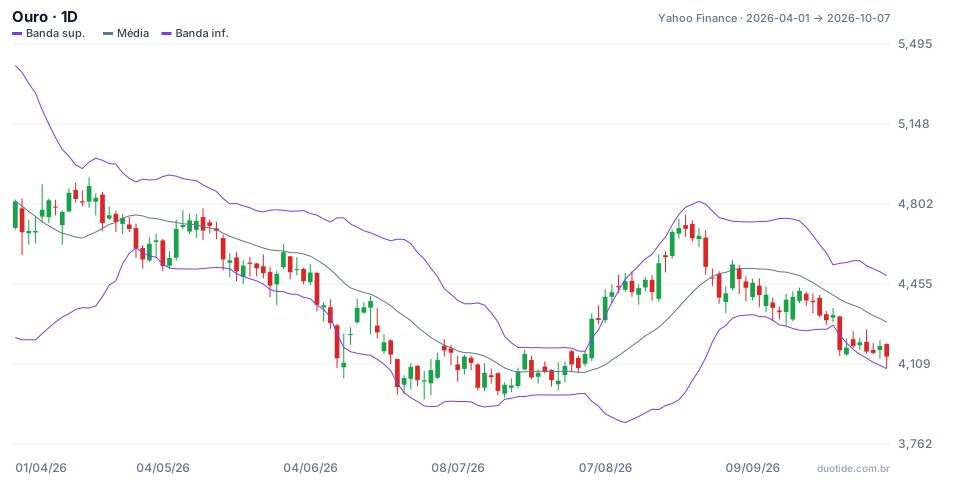
The chart shows gold with 20-period, 2-deviation Bollinger Bands. It illustrates well what a volatility indicator says, and what it doesn't:
April: wide bands
On April 1 the upper band was at $5,402.21 and the lower band at $4,223.20, a gap of 24.5% of the average's value. The market had come from weeks of sharp swings, and the ATR was above $190 in the first days of April.
August 4: the bands squeeze
On August 4 the gap between the bands fell to 4.5% of the average, the smallest of the period: the upper band at $4,163.65 and the lower band at $3,980.59, with gold at $4,152.60. Tight bands show low volatility, and many traders treat this squeeze as a warning that a bigger move may be near, without saying which way.
August: the breakout
On August 5, gold closed at $4,305.20, above the upper band ($4,220.10). In the following weeks the bands widened and the price reached $4,697.80 on August 24, 13.1% above the August 4 close. On that same day, the RSI hit 75.6, the period's highest. It was the volatility squeeze, not a trend indicator, that came before the rally; and it was the trend and momentum indicators that showed its strength afterward.
How to use and combine the types of indicators
One indicator from each family
A balanced combination uses at most one indicator from each family: one trend indicator for the direction, one momentum indicator for the entry timing, one volatility indicator to calibrate the stop, and, when reliable volume data exists, one volume indicator to confirm the strength.
Each family answers a different question
Trend: which way? Momentum: how fast? Volatility: how much does it swing? Volume: with how much participation? When two indicators answer the same question, the second one doesn't add information, it just repeats the first.
Limitations
All indicators are calculated from past price and volume, which is why they lag. Gold's ADX only peaked on July 20, almost three weeks after June 30's low: by the time the indicator showed its strongest downtrend reading, the worst of the decline had already passed. Futures and forex volume also varies from source to source, which makes volume indicators less reliable in those markets.

Common mistakes with technical indicators
- Filling the chart with the RSI, the stochastic, and another oscillator at the same time, thinking triple confirmation is stronger.
- Using a volatility indicator as if it showed direction: a tight band doesn't say whether the breakout will go up or down.
- Reading overbought in a strong trend as a sell signal.
- Changing parameters until the indicator gets the past right.
- Forgetting that the examples above describe what happened, not what will happen.
To practice without risking money, set up a chart in a demo account with one indicator from each family, pick an asset, and over a few weeks note what each one showed before the bigger moves. Your record will show which combination really helps the way you trade.
Practice before you risk. Open your Duotide account and test your ideas on the demo account with US$10,000 in virtual funds.
Create free accountUpdated:
Editorial character of the Duotide newsroom. Articles are written by the team with the help of artificial intelligence; prices and charts come from real market data. Explains charts, indicators and trading strategies: how they work, where they fail and how to test them first.
Was this article helpful?
Be the first to rate it.
Comments
- No comments yet. Be the first to comment.
Ready to put it into practice?
Open your account and practice on the demo account with US$10,000 in virtual funds, without risking money.
- Secure platformProtected login and identity verification
- Multilingual supportHelp available every day
- Free demo accountUS$10,000 virtual to practice
Trading involves the risk of losing the capital invested.
