

 Português pt
 Español es
 العربية ar
 বাংলা bn
 Deutsch de
 Filipino fil
 Français fr
 हिन्दी hi
 Bahasa Indonesia id
 Italiano it
 Русский ru
 Svenska sv
 ไทย th
 Türkçe tr
 Tiếng Việt vi
 简体中文 zh
Updated:
ForexWhat a Pip Is in Forex and How to Calculate Its Value
 Naomi TanakaEditorial character · Analysis Desk

Quick answer
A pip is the standard unit of movement in a currency pair: the fourth decimal place in most pairs (0.0001 on EUR/USD) and the second in yen pairs (0.01 on USD/JPY). In dollar-quoted pairs, like EUR/USD, each pip is worth exactly US$10 on a standard lot, US$1 on a mini lot, and US$0.10 on a micro lot. Knowing that value is what lets you calculate, before entering, how much you lose if the stop is hit.
Anyone starting out in forex quickly runs into a word that shows up in every strategy, every stop, and every risk calculator: pip. Understanding exactly what it means is the first step to knowing how much a trade can make or lose.
In this guide we use real daily EUR/USD quotes between April and October 2026, plus a few USD/JPY numbers, to do the math with actual prices.
What a pip is
Pip stands for percentage in point and is the smallest standard move in a pair's quote. In most pairs, like EUR/USD, the pip is the fourth decimal place: if the quote goes from 1.1250 to 1.1251, it moved 1 pip.
Many platforms show a fifth decimal place, called a pipette or fraction of a pip. In 1.12535, the last 5 is half a pip. That's why you often see distances like 529.2 pips.
The yen exception
In pairs with the Japanese yen, like USD/JPY, the pip is the second decimal place. If USD/JPY goes from 149.20 to 149.30, it moved 10 pips, not 0.10 pip. The difference exists because one yen is worth a tiny fraction of a dollar: quoting with four decimal places would produce impractical numbers.

How to calculate the value of a pip
The general rule is: pip value = pip size × number of units, in the quote currency (the second one in the pair).
- Standard lot (100,000 units) of EUR/USD: 0.0001 × 100,000 = US$10 per pip.
- Mini lot (10,000): 0.0001 × 10,000 = US$1 per pip.
- Micro lot (1,000): 0.0001 × 1,000 = US$0.10 per pip.
Since EUR/USD's quote currency is already the dollar, these values are exact and don't depend on the rate. On USD/JPY the result comes out in yen and needs converting: 0.01 × 100,000 = ¥1,000 per pip on a standard lot. With USD/JPY at 158.296 (the October 7, 2026 close), that's 1,000 ÷ 158.296 = US$6.32 per pip, and about US$0.63 on a mini lot. That value changes along with the rate.
Real example: EUR/USD in pips
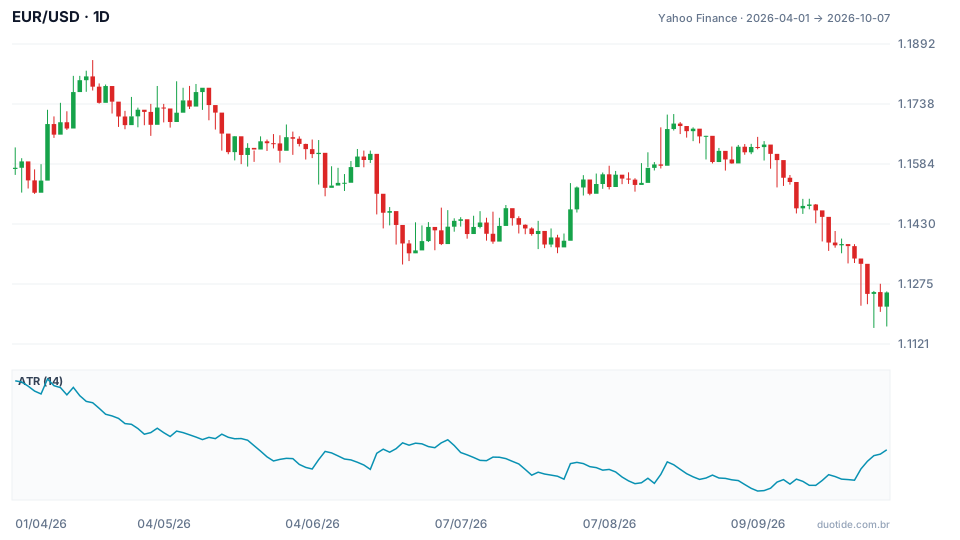
EUR/USD closed April 1, 2026 at 1.15742 and October 7, 2026 at 1.12535, down 2.77%. The period's high was 1.18511, on April 17, and the low 1.11623, on October 5. Below the price sits the 14-day ATR, which shows the average daily range. In pips, it varied quite a bit.
From April's top to October
Between the April 17 close (1.17827) and the October 7 close (1.12535), the difference was 0.05292, or 529.2 pips. On a mini lot, that amounts to 529.2 × US$1 = US$529.20: a gain for anyone short, a loss for anyone long, before spread and holding costs.
An ordinary day changed in size
The ATR reached 96.5 pips on April 8, dropped to 47.3 pips on September 9 (the period's lowest value), and stood at 65.4 pips on October 7. In April, a typical day moved twice as much as in September. A 30-pip stop that seemed generous in September would have sat well within a single day's noise in April.
Position size starting from the pips
On a US$5,000 account with a 1% risk (US$50) and a stop of 1.5 ATR:
- On October 7: stop of 1.5 × 65.4 = 98.1 pips → 50 ÷ 98.1 = US$0.51 per pip → 5 micro lots (US$0.50 per pip, a risk of US$49.05).
- On September 9: stop of 1.5 × 47.3 = 70.95 pips → 50 ÷ 70.95 = US$0.70 per pip → 7 micro lots (a risk of US$49.67).
The money risk stayed the same; what changed was the size, adjusted to volatility. On USD/JPY, the ATR on October 7 was 1.255, or 125.5 pips, a reminder that a distance in pips can't be compared across pairs without looking at the value of each pip. The examples describe what happened, not what will happen.

How to use the pip in risk management
Calculate the risk before entering
Stop distance in pips × pip value = planned maximum loss. If the number is bigger than what you accept losing, reduce the lot, not the stop.
Set the stop from the chart, the lot from the account
The stop goes where the analysis says the idea is wrong; the lot size is what adjusts to fit the risk. Doing it the other way around, shrinking the stop to fit a big lot, is the recipe for getting stopped out by noise.
Include the spread
The spread is also measured in pips. On a 20-pip stop, a 2-pip spread already eats up 10% of the distance.
Limitations
The pip value is exact only when the quote currency matches your account's currency. In other cases it changes with the exchange rate, and on accounts in reais there's also the conversion to the account's currency. Gaps and news can push the loss past the planned number of pips.
Common mistakes with the pip
- Confusing a pip with a pipette and getting the distance wrong by a factor of ten.
- Forgetting that in yen pairs the pip is the second decimal place.
- Assuming a pip is worth US$10 in every pair: that's only exact when the dollar is the quote currency.
- Using the same pip stop across periods with very different volatility.
- Ignoring the spread when calculating the risk.
To practice, open EUR/USD and a yen pair on a demo account, add the 14-day ATR, and, before every trade, write down the stop distance in pips, the pip value for the lot you chose, and the maximum money loss. Then compare it with the actual result: within a few weeks the math becomes automatic.
Practice before you risk. Open your Duotide account and test your ideas on the demo account with US$10,000 in virtual funds.
Create free accountUpdated:
Editorial character of the Duotide newsroom. Articles are written by the team with the help of artificial intelligence; prices and charts come from real market data. Explains charts, indicators and trading strategies: how they work, where they fail and how to test them first.
Was this article helpful?
Be the first to rate it.
Comments
- No comments yet. Be the first to comment.
Ready to put it into practice?
Open your account and practice on the demo account with US$10,000 in virtual funds, without risking money.
- Secure platformProtected login and identity verification
- Multilingual supportHelp available every day
- Free demo accountUS$10,000 virtual to practice
Trading involves the risk of losing the capital invested.
