

 Português pt
 Español es
 العربية ar
 বাংলা bn
 Deutsch de
 Filipino fil
 Français fr
 हिन्दी hi
 Bahasa Indonesia id
 Italiano it
 Русский ru
 Svenska sv
 ไทย th
 Türkçe tr
 Tiếng Việt vi
 简体中文 zh
Updated:
StocksVertiv (VRT) Stock in 2026: Analyzing AI Infrastructure
 Rafael AzevedoEditorial character · Markets Desk

Quick answer
Vertiv (VRT) supplies power, cooling and racks for artificial intelligence data centers, so its stock tracks the AI investment cycle. In 2026 the stock more than doubled through May, then fell more than 40% by the end of July, and closed October 7 up 52.1% for the year. What weighs most on the stock is its ability to turn the order backlog into revenue and the risk of large customers cutting investment.
When the topic is artificial intelligence, attention usually goes straight to whoever makes the chips. But there's a group of companies that makes money off a less glamorous problem: keeping a data center full of powerful processors running, cooled and online without interruption. Vertiv, traded on the US market under the ticker VRT, is one of the leading suppliers of that infrastructure, and that's why the stock became one of the most discussed names in the sector in 2026.
This article explains what the company does, what numbers it has reported, and what the real daily chart of the stock showed from January to October 2026. The business figures reflect what was published around the middle of the year and may be dated. Nothing here is a recommendation to buy or sell.
What Vertiv does
Vertiv doesn't make processors or build servers. Its business is the physical layer that keeps that equipment running: power systems, cooling, racks and monitoring software that prevent failures and overheating. The denser and more powerful a data center built to train AI models gets, the more heat it generates and the more complex the cooling engineering becomes, including liquid cooling.
An important part of the business model is acting as a design partner for chipmakers and cloud providers, taking part in planning new data centers before they're even built. That creates a relationship that's harder to replace than a typical supplier's.

The numbers reported in 2026
According to figures released by the company and by market sources in mid-2026:
- Revenue growth of about 27.7% year over year, with an operating margin above 20%.
- Order backlog above US$ 15 billion.
- 2026 sales guidance between US$ 13.5 billion and US$ 14 billion, up from an annual base of about US$ 10.2 billion.
- First-quarter 2026 operating income about 64% higher than a year earlier.
- Entry into the S&P 500 in March 2026, which tends to draw buying from funds that track the index.
A simple calculation helps put the guidance in perspective: going from US$ 10.2 billion to the midpoint of US$ 13.75 billion means growing about 35% in a year. That's a high bar, and the stock's price now depends on hitting it.
Real example: VRT stock and the 50-day average in 2026
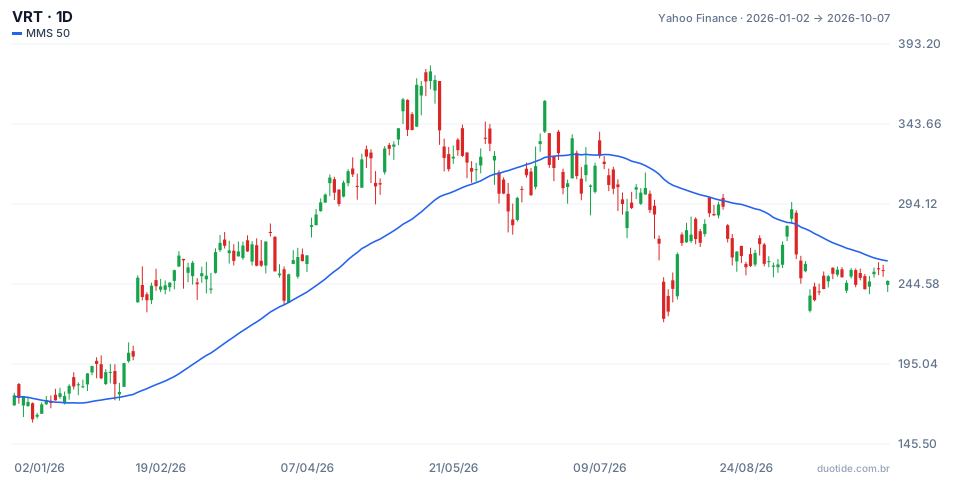
The chart shows VRT's daily candles (Yahoo Finance) with the 50-day simple moving average. The stock closed 2025 at US$ 162.01 and, on October 7, 2026, stood at US$ 246.49, up 52.1% for the year. The path, though, went through three very different phases.
January to June: a clean trend above the average
From January 15 to June 4, the stock closed every day above the 50-day average. The year's biggest jump came on February 11, up 24.5% in a single session (from US$ 199.62 to US$ 248.51). The closing high came on May 14, at US$ 376.23, more than double the 2025 close.
June: the average stops helping
On June 5, VRT closed below the average for the first time in almost five months, at US$ 300.51. Over the following four weeks the price crossed the average six times, up and down. On June 22 it reached US$ 357.96, and the next day it fell 11.1%. Anyone trading every crossover would have collected a string of contradictory signals: that's the typical behavior of a trend losing strength.
July to October: a sharp drop and price below the average
On July 29 the stock fell 17.3% in a single day, from US$ 269.56 to US$ 223.04. That close was 40.7% below May's high. Since July 1, VRT has closed above the 50-day average on only one day, September 8 (US$ 290.83); the next day it fell 9.6%. On October 7 the average stood at US$ 258.88, above the price.

How to analyze Vertiv's stock
Track whether the backlog turns into revenue
A multibillion-dollar order backlog is only worth something if it's delivered on time and with margin. At every quarterly result, compare revenue, operating margin and backlog growth against the annual guidance.
Watch the customers
Vertiv's demand depends on data center investment from the big cloud and AI companies. Those customers' capital spending announcements are an indirect gauge for Vertiv's orders.
Use the chart to measure risk, not to guess
The 2026 chart shows the scale of the possible swings. On a US$ 5,000 position, the 17.3% drop on July 29 would represent a loss of about US$ 863 in a single day, and a stop doesn't protect against a gap down, because the order fills at the first price available. That's why position size matters as much as the entry point.
Limitations
Moving averages describe the past trend and fail during transition phases, like June. The business figures cited are from mid-2026 and change every quarter. And a stock that already has a lot of optimism priced in tends to react sharply to small disappointments.
Common mistakes when analyzing Vertiv's stock
- Treating VRT as a sure bet just because it's linked to artificial intelligence.
- Looking only at revenue growth and ignoring the execution risk in delivering the order backlog.
- Forgetting the concentration in a few large customers, who could cut investment or build their own solutions.
- Sizing the position as if the stock were low-volatility, when it had days of +24.5% and -17.3% in the same year.
- Trading every crossover of the 50-day average during a sideways phase, as in June.
- Reading the 2026 chart as a forecast: it describes what happened, not what will happen.
To study the stock without risking money, open VRT's daily chart on a demo account, add the 50-day average, simulate positions sized by risk, and log how the price reacted after every quarterly result. That track record teaches more about the stock than any ready-made opinion.
Practice before you risk. Open your Duotide account and test your ideas on the demo account with US$10,000 in virtual funds.
Create free accountUpdated:
Editorial character of the Duotide newsroom. Articles are written by the team with the help of artificial intelligence; prices and charts come from real market data. Follows the news that moves prices — rates, stock markets, companies and commodities — explained without jargon.
Was this article helpful?
Be the first to rate it.
Comments
- No comments yet. Be the first to comment.
Ready to put it into practice?
Open your account and practice on the demo account with US$10,000 in virtual funds, without risking money.
- Secure platformProtected login and identity verification
- Multilingual supportHelp available every day
- Free demo accountUS$10,000 virtual to practice
Trading involves the risk of losing the capital invested.
