

 Português pt
 Español es
 العربية ar
 বাংলা bn
 Deutsch de
 Filipino fil
 Français fr
 हिन्दी hi
 Bahasa Indonesia id
 Italiano it
 Русский ru
 Svenska sv
 ไทย th
 Türkçe tr
 Tiếng Việt vi
 简体中文 zh
Updated:
StocksWhat Is Equity Trading and How to Start Trading Stocks
 Rafael AzevedoEditorial character · Markets Desk

Quick answer
Equity trading is buying and selling shares of publicly traded companies to profit from price moves over short periods, from minutes to a few months. Unlike long-term investing, the focus is on the timing of entry and exit, position size, and controlling the risk of each trade.
Anyone investing in stocks usually thinks in years: they buy into a company because they believe in the business's growth and accept the swings along the way. Anyone doing equity trading thinks in days, weeks, or, at most, a few months, and cares more about the timing of entry and exit than about the company's value a decade from now.
In this guide we explain how stock trading works, the most common styles, and, using Apple's real daily quotes (AAPL, Yahoo Finance data) between April and October 2026, how a simple trend rule and a position-sizing calculation played out in practice.
What Equity Trading Is
Equity is the term for ownership stake in a company, in other words, stock. Equity trading is trading those shares with a short-term goal. Orders go through a stock exchange, a regulated environment where buyers and sellers are connected electronically through an authorized broker.
There are three basic order types:
- Market order: executes right away, at the best available price.
- Limit order: sets the maximum buy price or the minimum sell price.
- Stop order: triggers when the price reaches a defined level, usually to limit losses.
The Most Common Styles
- Day trading: opens and closes the position in the same session, never holding overnight. It avoids overnight gap risk, but demands fast decisions.
- Swing trading: trades last from a few days to a few weeks and don't require watching the screen all the time.
- Position trading: trades lasting weeks or months, usually combining technical analysis with the company's earnings.
What Moves a Stock's Price
The price reflects the market's expectation of the company's future value. Quarterly earnings, revenue, margins, and guidance change that expectation. Interest rates and inflation affect the market as a whole, and overall risk appetite can move prices even with no fresh news about the company.

How to Calculate Position Size
The most important calculation for anyone trading stocks isn't about profit, it's about risk. A common approach is to use the ATR (average true range), which measures how much the price typically moves per day, to set the stop, and the risk accepted per trade to set the quantity.
With real Apple data on 10/07/2026: a close at $336.67 and a 14-day ATR of $6.58.
- A $10,000 account and 1% risk per trade: $100 at most.
- A stop at 2 ATR from the entry price: 2 × 6.58 = $13.16 per share.
- Quantity: 100 ÷ 13.16 = 7.6, rounded down: 7 shares.
- Position value: 7 × 336.67 = $2,356.69, about 24% of the account.
Notice that position size comes from the risk, not from how much the person wants to make. If the ATR doubles, the quantity is cut in half to keep the same $100 at stake.
Real Example: Apple in 2026
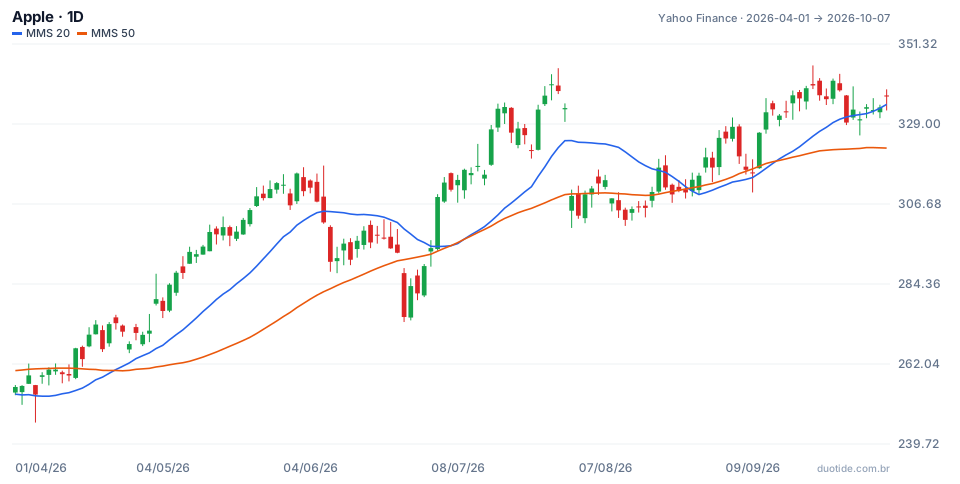
The chart shows Apple's daily sessions with the 20- and 50-day simple moving averages. Between 04/01 ($255.63) and 10/07 ($336.67), the stock rose 31.7%, with a low of $245.70 on 04/07 and a high of $345.34 on 09/22. A popular trend-following rule is to stay long while the 20-day average is above the 50-day. Three moments show what it actually did:
April 23: the Crossover That Caught the Rally
The 20-day average crossed above the 50-day with the stock at $273.43. Ten sessions later, the price stood at $287.44, up 5.1%. This was the signal that caught the start of the period's uptrend.
July and August: False Signals
On 07/07 the 20-day average crossed below the 50-day, with the stock at $310.66. Two sessions later, on 07/09, it crossed back above, at $316.22. On 08/26 came another bearish crossover, at $313.45, and ten sessions later the stock was at $326.57, 4.2% higher. Anyone selling on each bearish signal would have exited right before rallies.
July 31: the Risk of Holding Overnight
Apple closed 07/30 at $333.43 and opened 07/31 at $304.81, an 8.6% downside gap. No stop executes between one close and the next open. With the 7 shares from the example above, the loss at the open would be 7 × 28.62 = $200.34, double the planned $100. That day, the ATR reached $9.87, the period's highest.
These cases describe what happened, not what will happen.

How to Start Trading Stocks
Choose a Few Liquid Stocks
Start with a small group of heavily traded stocks. They have tighter spreads and swings that are easier to manage. Apple averaged 49.3 million shares traded per day over the chart's period.
Define a Style and a Chart Timeframe
Day trading, swing trading, and position trading call for different routines. Mixing all three at the start is one of the fastest ways to lose track of what's actually working.
Have an Entry and Exit Rule
Following the trend, trading breakouts, or betting on a reversion to the mean are well-known approaches. Any of them needs a written criterion before the trade, including for the exit.
Limitations
Moving-average rules lag: signals come after the move has already started and fail in sideways markets, as in July and August. The ATR calculation doesn't protect against gaps, like the one on 07/31. For Apple, 18 of the period's 131 sessions opened more than 1% away from the previous close.
Common Mistakes Beginners Make
- Opening positions without a clear entry and exit criterion.
- Setting quantity by the desired profit instead of the accepted risk.
- Increasing position size after a loss to recover quickly.
- Holding onto a losing trade waiting for a turnaround and selling the winning one too soon.
- Ignoring gap risk when holding a position overnight, especially close to earnings.
- Forgetting that the examples above describe what happened, not what will happen.
To practice without risking money, open a liquid stock's chart in a demo account, add the 20- and 50-day averages and the ATR, calculate each position's size before entering, and log the results for a few weeks. Your own record will show more than any ready-made rule.
Practice before you risk. Open your Duotide account and test your ideas on the demo account with US$10,000 in virtual funds.
Create free accountUpdated:
Editorial character of the Duotide newsroom. Articles are written by the team with the help of artificial intelligence; prices and charts come from real market data. Follows the news that moves prices — rates, stock markets, companies and commodities — explained without jargon.
Was this article helpful?
Be the first to rate it.
Comments
- No comments yet. Be the first to comment.
Ready to put it into practice?
Open your account and practice on the demo account with US$10,000 in virtual funds, without risking money.
- Secure platformProtected login and identity verification
- Multilingual supportHelp available every day
- Free demo accountUS$10,000 virtual to practice
Trading involves the risk of losing the capital invested.
