

 Português pt
 Español es
 العربية ar
 বাংলা bn
 Deutsch de
 Filipino fil
 Français fr
 हिन्दी hi
 Bahasa Indonesia id
 Italiano it
 Русский ru
 Svenska sv
 ไทย th
 Türkçe tr
 Tiếng Việt vi
 简体中文 zh
Updated:
BeginnersWhat Spread Is in Trading and How It Affects Your Trades
 Marina CostaEditorial character · Beginner's Guide
Quick answer
Spread is the difference between an asset's buy price (ask) and sell price (bid) at the same instant. Every trade starts out negative by the amount of the spread, and the price needs to move at least that distance in your favor just for you to break even. The shorter the trade and the smaller the target, the bigger the slice of the result the spread eats up.
Anyone who opens a trade and sees the result start out in the red, without the price having moved at all, has just met the spread. It doesn't show up as a fee on the statement, but it's in every entry and exit, and it's the first cost any strategy needs to overcome.
To show the size of this cost concretely, we compared the spread with EUR/USD's real daily move, measured by the 14-day ATR (average true range) between April and October 2026.
What Spread Is
Every traded asset has two prices at the same time. The bid is the price someone is willing to pay, and it's the price you sell at. The ask is the price someone is willing to sell at, and it's the price you buy at. The ask is always higher than the bid, and the difference is the spread.
The ones keeping both sides available all the time are liquidity providers: banks, brokers, and market makers. The spread compensates them for the risk of always being ready to trade. Heavily traded assets, like the major currency pairs and the most liquid stocks, have tight spreads; low-volume assets have wide ones.
Fixed and Variable Spread
Some instruments are offered with a fixed spread. Most have a variable spread, which widens when liquidity drops: at the turn of the day, on holidays, at market opens, and especially in the seconds around major economic data, like the US jobs report.

How to Calculate the Spread
The calculation has two steps: the distance in points and the value in dollars.
- Spread in price: ask − bid.
- Spread in pips: on EUR/USD, 1 pip is 0.0001. Divide the difference by 0.0001.
- Dollar cost: spread in pips × the pip value for the size traded. In a standard lot of 100,000 euros, 1 pip is worth $10; in a mini lot of 10,000, $1.
Example With the Real Close
EUR/USD closed 10/07/2026 at 1.12535. Suppose a quote around that price with the bid at 1.12528 and the ask at 1.12543. The spread is 1.12543 − 1.12528 = 0.00015, or 1.5 pips. On a mini lot, that costs 1.5 × $1 = $1.50 per trade; on a standard lot, $15. Anyone making 20 trades a month with a standard lot pays 20 × $15 = $300 in spread alone, before any other fee.
Real Example: Spread Against EUR/USD's Move
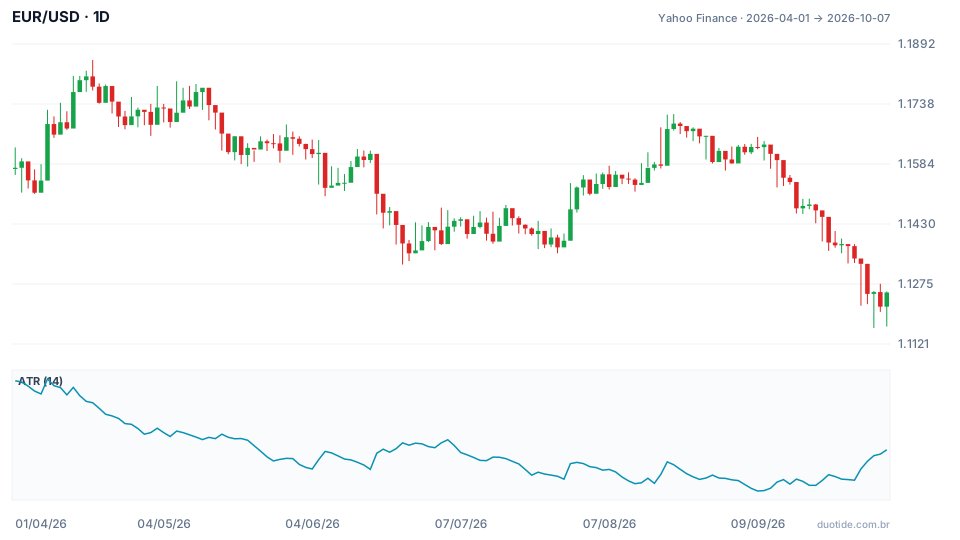
The bottom panel shows the 14-day ATR, which estimates how much the pair moved per day, on average, including the jumps between one close and the next open. Over the period, EUR/USD fell from 1.1574 (04/01) to 1.12535 (10/07), a 2.8% drop, with a high of 1.1851 on 04/17 and a low of 1.1162 on 10/05.
April: the Most Active Day
On 04/08/2026 the ATR reached 96.5 pips, the window's highest value. A 1.5-pip spread represented 1.5 ÷ 96.5 = 1.6% of the average daily move. For anyone holding the position for a day or more, that's a small cost.
September: the Calmer Market
On 09/09/2026 the ATR dropped to 47.3 pips, less than half of April's. The same spread now weighed 1.5 ÷ 47.3 = 3.2% of the daily move. On calm days, the fixed cost of entering becomes proportionally bigger, because the price moves less to pay for it.
October and the Weight for Short-Term Traders
On 10/07 the ATR stood at 65.4 pips. For anyone targeting the day's move, 1.5 pips is 2.3% of that. But a scalper aiming for 5 pips per trade hands over 1.5 ÷ 5 = 30% of the target to the spread. If the strategy wins 55% of the time with a 5-pip target and stop, the gross result per trade would be 0.55 × 5 − 0.45 × 5 = 0.5 pip. After subtracting the 1.5-pip spread, it becomes −1 pip per trade: a strategy that looked positive starts losing money.
How to Reduce the Spread's Effect
Trade During the Hours of Highest Liquidity
In forex, the overlap between the London and New York sessions usually has the tightest spreads. The turn of the day and the Asian overnight hours, for European pairs, usually have the widest.
Avoid the Seconds Around News
When major data comes out, the spread can multiply several times over, and a market order can get filled far from the price that was showing on the screen. If your strategy doesn't depend on the news, wait for the dust to settle.
Compare the Spread With the Target
A practical rule: if the spread exceeds 10% of the trade's target, the cost is already significant. Bigger targets, on longer-timeframe charts, dilute the spread.
Use Limit Orders When It Makes Sense
A limit order sets the maximum buy price or minimum sell price and avoids getting caught paying a suddenly wider spread, at the risk of not being executed.
Limitations of This Math
The ATR is calculated from daily candles and doesn't show the real spread at any given moment, which varies between platforms and throughout the day. The spreads used here are examples to illustrate the math; always check the value shown when you place the order.
Common Mistakes With the Spread
- Testing a strategy without subtracting the spread from each entry and exit.
- Trading targets so small that the spread eats up a large part of the gain.
- Placing market orders at the exact moment of major news.
- Comparing spreads in pips between different assets without converting to dollars or to a percentage of the move.
- Ignoring that the spread tends to widen outside the asset's main trading hours.
To practice, open a demo account, note the spread of the asset you follow at three different times over a week, and add that cost to every trade you log. Seeing the accumulated number at the end of the month helps decide which hours and which targets are worth trading.
Practice before you risk. Open your Duotide account and test your ideas on the demo account with US$10,000 in virtual funds.
Create free accountUpdated:
Editorial character of the Duotide newsroom. Articles are written by the team with the help of artificial intelligence; prices and charts come from real market data. Answers the first questions of those just starting out: account, platform, basic concepts and common mistakes.
Was this article helpful?
Be the first to rate it.
Comments
- No comments yet. Be the first to comment.
Ready to put it into practice?
Open your account and practice on the demo account with US$10,000 in virtual funds, without risking money.
- Secure platformProtected login and identity verification
- Multilingual supportHelp available every day
- Free demo accountUS$10,000 virtual to practice
Trading involves the risk of losing the capital invested.
