

 Português pt
 Español es
 العربية ar
 বাংলা bn
 Deutsch de
 Filipino fil
 Français fr
 हिन्दी hi
 Bahasa Indonesia id
 Italiano it
 Русский ru
 Svenska sv
 ไทย th
 Türkçe tr
 Tiếng Việt vi
 简体中文 zh
Updated:
StrategiesSwing Trading in Practice: Entry, Stop, and Target
 Naomi TanakaEditorial character · Analysis Desk

Quick answer
To apply swing trading, before entering define the trend's direction, an objective trigger, the stop, and the position size. A common plan uses 20- and 50-period moving averages on the daily chart, a stop at 2 ATRs from the entry, and 1% of the account risked per trade. Positions stay open from a few days to a few weeks.
Knowing what swing trading is is the easy part. The hard part is turning the idea into a plan that says, before you click, where to enter, where to exit if it goes wrong, how much to buy, and when to take profit. This guide builds that plan step by step and tests it in a real situation: Nvidia's daily quotes (NVDA, Nasdaq) between March and October 2026.
The goal isn't to show a rule that always wins, because no such thing exists. It's to show how each decision changes the result and why the exit rule matters as much as the entry.
What Defines a Swing Trade
In swing trading, the position stays open from a few days to a few weeks, trying to capture a whole leg of a trend. That's why the trader works with daily or 4-hour charts, accepts holding the position overnight, and needs a stop wide enough to withstand the normal swings across several sessions.
In practice, every swing-trade plan answers four questions:
- Direction: is the asset in an uptrend, a downtrend, or sideways?
- Trigger: what objective event authorizes the entry?
- Risk: where does the stop sit, and how much money does that represent?
- Exit: what closes the trade, whether in profit or at a loss?

How to Build the Plan Step by Step
1. Direction With Moving Averages
A simple way to filter the trend is to use two exponential moving averages on the daily chart, the 20- and the 50-period. With the 20-EMA above the 50-EMA, the bias is bullish; below, bearish. The 20-EMA crossing above the 50-EMA works as the entry trigger.
2. Stop by the ATR
The 14-period ATR (average true range) shows how much the asset typically moves per day. A stop at 2 ATRs from the entry sits outside the daily noise without being arbitrarily far away.
3. Position Size
First you decide how much of the account you're willing to lose on the trade, say 1%. Then you divide that amount by the distance to the stop. The number of shares comes from the math, not from how much you want.
4. Exit Rule
It can be a fixed target (for example, twice the risk), the original stop, or a trailing exit, like closing the position when the price closes below the 20-EMA. Each choice produces a different result, as the example shows.
Real Example: a Trade on Nvidia in August 2026
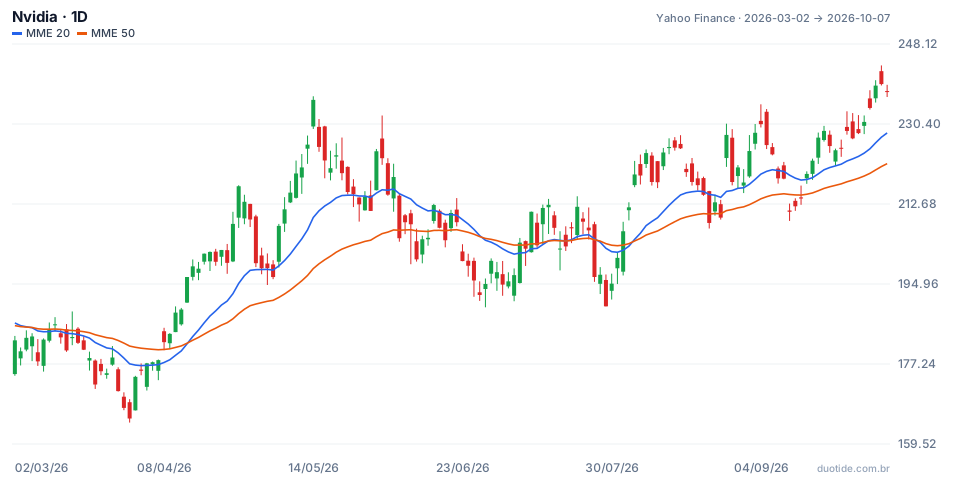
In the chart, the blue line is the 20-EMA and the orange one, the 50-EMA. Between 03/02/2026 and 10/07/2026 the stock went from $182.48 to $237.47, up 30.1%, with a low of $164.27 on 03/30 and a high of $243.37 on 10/06.
The Trigger and the Position Calculation
On 08/05/2026 the 20-EMA ($204.85) crossed above the 50-EMA ($204.49), with the stock closing at $219.22. The 14-day ATR stood at $7.88. With a hypothetical $10,000 account and 1% risk per trade:
- Maximum risk: 1% of $10,000 = $100
- Stop distance: 2 × $7.88 = $15.75 → stop at $219.22 − 15.75 = $203.47
- Quantity: $100 ÷ $15.75 = 6.35 → 6 shares ($1,315.32 of exposure and $94.50 of real risk)
- A target of twice the risk: $219.22 + 2 × 15.75 = $250.72
Exit A: a Close Below the 20-EMA
On 08/21 the stock closed at $214.72, below the 20-EMA ($215.45). With this rule, the trade would have closed right there, with a loss of $4.50 per share, or $27.00 on the 6 shares (0.27% of the account). Small, but a loss.
Exit B: a Fixed Stop and a 2R Target
With the stop at $203.47, the trade survived August's drop: the lowest low after entry was $207.25, on 08/24. The $250.72 target wasn't hit either, since the period's high stayed at $243.37. On 10/07 the stock closed at $237.47, an open gain of $18.25 per share, or $109.50, about 1.16 times the risk taken.
The same entry, with two exit rules, produced a small loss in one and an open gain in the other. Neither one is the right one: exit A protects more against long declines, B gives the move more room and accepts more swing.
When the Signal Fails: July
The same trigger also generated a bad signal. On 07/15 the 20-EMA crossed above with the stock at $212.50; on 07/28 it crossed back below with the price at $197.01, down 7.3%. In a sideways market, moving-average crossovers repeat, and each one turns into a small loss. This is why limiting position size to 1% matters: the damage from a false signal needs to fit comfortably in the account.

How to Use Swing Trading Day to Day
Analysis Routine
Since the chart is daily, analyzing once a day, preferably after the close, is enough. Update the stops, check whether any trigger showed up, and log it. Watching a minute chart for a swing trade usually leads to impulsive exits.
Choosing the Exit Rule
Define the exit before entering and keep the same rule across a large number of trades. Switching rules every trade, based on whichever would have made more money on the last one, makes it impossible to know whether the method works.
Overnight and Weekend Risk
A stock can open far from the previous close after a quarterly earnings report or a news event. In these cases the stop executes at the first available price, worse than planned. Reducing the position ahead of known events, like earnings, is one way to deal with this.
Limitations
Moving averages are calculated from past prices and always arrive late: the April crossover, on 04/15, happened with the stock at $198.87, already 21% above March's low. In markets with no trend, the method generates strings of false signals. And the result of one trade, good or bad, says nothing about the next.
Common Mistakes When Applying Swing Trading
- Entering without knowing where the stop is and calculating the position size afterward.
- Using a day-trade-sized stop that's too tight for a trade that needs several days to develop.
- Changing the exit rule mid-trade because the price moved against you.
- Risking much more than 1% or 2% of the account per trade and running out of breathing room for the false signals.
- Ignoring the earnings and news calendar that can trigger gaps overnight.
- Treating the example above as a forecast: it describes what happened, not what will happen.
Before using real money, apply the plan in a demo account: choose an asset, add the 20- and 50-period averages and the ATR, calculate each position as in the example, and log the entry, stop, exit, and result of every trade. After a few dozen entries, you'll have your own data to decide whether the method fits you.
Practice before you risk. Open your Duotide account and test your ideas on the demo account with US$10,000 in virtual funds.
Create free accountUpdated:
Editorial character of the Duotide newsroom. Articles are written by the team with the help of artificial intelligence; prices and charts come from real market data. Explains charts, indicators and trading strategies: how they work, where they fail and how to test them first.
Was this article helpful?
Be the first to rate it.
Comments
- No comments yet. Be the first to comment.
Ready to put it into practice?
Open your account and practice on the demo account with US$10,000 in virtual funds, without risking money.
- Secure platformProtected login and identity verification
- Multilingual supportHelp available every day
- Free demo accountUS$10,000 virtual to practice
Trading involves the risk of losing the capital invested.
