

 Português pt
 Español es
 العربية ar
 বাংলা bn
 Deutsch de
 Filipino fil
 Français fr
 हिन्दी hi
 Bahasa Indonesia id
 Italiano it
 Русский ru
 Svenska sv
 ไทย th
 Türkçe tr
 Tiếng Việt vi
 简体中文 zh
Updated:
StrategiesWhat Is Swing Trading and How It Works
 Naomi TanakaEditorial character · Analysis Desk
Quick answer
Swing trading is a trading style where the position stays open from a few days to a few weeks, to capture one leg of a price move. It sits between day trading, which closes everything out the same day, and long-term investing. It mainly uses daily charts, requires less screen time, and accepts the risk of the price opening far from the previous close.
Between day trading, which closes all positions the same day, and long-term investing, which can last years, there's an intermediate style: swing trading. It's one of the most common ways to trade for anyone who can't spend the day in front of the screen but wants to use technical analysis actively.
In this article you'll see what characterizes swing trading, how it differs from the other styles, what risks are specific to it, and an example with Apple's real quotes (AAPL, Nasdaq) between April and October 2026.
What Swing Trading Is
The name comes from swing. Any asset's price moves in waves: it rises for a few days, corrects, rises again. The swing trader tries to capture one of these waves, or part of it, keeping the position open from two or three days to a few weeks.
Three traits define the style:
- Timeframe: days to weeks, with positions held overnight and over the weekend.
- Charts: mainly the daily and the 4-hour, instead of the minute charts used in day trading.
- Decisions: entry, stop, and target defined beforehand, based on trend, support, resistance, and indicators.

Swing Trading, Day Trading, and Long-Term Investing
Compared to Day Trading
The day trader seeks small moves and closes everything out before the close. The swing trader seeks bigger moves and accepts overnight risk. In exchange, they need less screen time: one analysis a day, after the close, is usually enough. The cost is that the stop needs to be wider, and the position smaller, for the dollar loss to stay the same.
Compared to Long-Term Investing
The long-term investor decides based on fundamentals and tolerates drawdowns lasting months. The swing trader decides based on price behavior and exits when the move's leg ends or when the stop is hit, even if they like the company.
How a Swing Trade Works
A common playbook has four steps: identify the trend on the daily chart, wait for an objective trigger (like a moving-average crossover or a break above resistance), place the stop at a distance that matches the asset's volatility, and calculate the quantity so the maximum loss stays at 1% or 2% of the account.

Real Example: Swing Trading on Apple in 2026
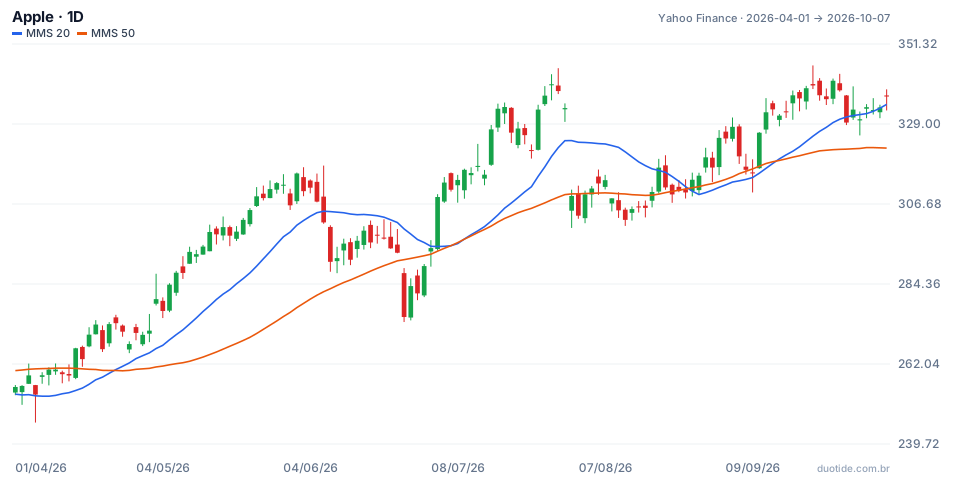
The chart shows the 20-day simple moving average (blue) and the 50-day (orange). Between 04/01/2026 and 10/07/2026 the stock went from $255.63 to $336.67, up 31.7%. The two averages crossed five times over the period, and each crossover tells part of the story.
April: a Wave Captured
On 04/23 the 20-day average crossed above the 50-day, with the stock at $273.43. The 14-day ATR, which measures the average daily swing, was $6.04. With a hypothetical $10,000 account and 1% risk:
- A 2-ATR stop: $273.43 − 12.09 = $261.34
- Quantity: $100 ÷ $12.09 = 8.27 → 8 shares
- A target of twice the risk: $273.43 + 24.18 = $297.61
The lowest low after entry was $265.07, on 04/27, above the stop. On 05/13, 14 sessions later, the high reached $300.92 and the target was hit: a gain of $24.18 per share, or $193.44 on the 8 shares. This is the typical swing-trade scenario: a few days of back-and-forth and then a whole leg up.
July: Overnight Risk
On 07/30 the stock closed at $333.43. The next day it opened at $304.81, 8.6% lower, and closed at $308.91, down 7.35%. Anyone long with a 2-ATR stop (the ATR was $8.06, putting the stop at $317.31) wouldn't have exited at the stop: the order would only fill near the open, at $304.81. The loss per share would be $28.62, not the planned $16.12, 1.78 times what was expected. This is the risk the day trader doesn't take on and the swing trader has to accept.
July to September: Signals That Cancel Each Other Out
On 07/07 the averages crossed down with the stock at $310.66, and two sessions later, on 07/09, crossed back up at $316.22. The same thing happened on 08/26 (down, at $313.45) and on 09/15 (up, at $331.34). When the market moves sideways, crossovers repeat and generate a string of small losses.
How to Use Swing Trading
Choose Liquid Assets
Large-cap stocks, indexes, major currency pairs, and higher-volume cryptocurrencies have smaller spreads and less frequent gaps than lightly traded assets.
Size by the Stop, Not by the Capital
Since the swing trade's stop is wide, the quantity needs to be calculated from it. In the example, 8 shares represented about $2,190 of exposure to risk $100.
Respect the Calendar
Earnings releases, rate decisions, and inflation data are the most common causes of gaps. Reducing or closing the position ahead of these events is a risk decision, not a forecast.
Limitations
Average-based indicators lag and fail in a sideways market. The stop doesn't guarantee the exit price when there's a gap. And costs like commissions, spread, and, on some instruments, overnight financing fees, reduce the result of every trade.
Common Mistakes in Swing Trading
- Watching the trade on a minute chart and exiting because of the day's normal wiggles.
- Using the same position size as day trading with a much wider stop.
- Forgetting that the stop can execute well below what was planned after a gap.
- Trading every moving-average crossover, even when the market is clearly sideways.
- Holding a losing position for weeks, turning the swing trade into an investment with no plan.
- Reading the examples as a promise: they show what happened, not what will happen.
To get started without risking money, open a demo account, choose two or three liquid assets, and follow the daily chart for a few weeks. For each simulated trade, note the reason for the entry, the stop, the calculated quantity, and the result. This record will show whether the style fits your routine before any real money is invested.
Practice before you risk. Open your Duotide account and test your ideas on the demo account with US$10,000 in virtual funds.
Create free accountUpdated:
Editorial character of the Duotide newsroom. Articles are written by the team with the help of artificial intelligence; prices and charts come from real market data. Explains charts, indicators and trading strategies: how they work, where they fail and how to test them first.
Was this article helpful?
Be the first to rate it.
Comments
- No comments yet. Be the first to comment.
Ready to put it into practice?
Open your account and practice on the demo account with US$10,000 in virtual funds, without risking money.
- Secure platformProtected login and identity verification
- Multilingual supportHelp available every day
- Free demo accountUS$10,000 virtual to practice
Trading involves the risk of losing the capital invested.
