

 Português pt
 Español es
 العربية ar
 বাংলা bn
 Deutsch de
 Filipino fil
 Français fr
 हिन्दी hi
 Bahasa Indonesia id
 Italiano it
 Русский ru
 Svenska sv
 ไทย th
 Türkçe tr
 Tiếng Việt vi
 简体中文 zh
Updated:
Technical analysisTrading Volume: What It Is and Why It Matters So Much
 Naomi TanakaEditorial character · Analysis Desk

Quick answer
Trading volume is the quantity of assets traded over a period. It matters because it shows how much participation is behind a move: rallies and breakouts with above-average volume tend to be more reliable than ones made on weak volume. High volume confirms interest, but by itself it doesn't indicate the price's future direction.
Price shows where the market went; volume shows how many people were willing to take it there. Two identical candles can mean very different things if one was traded by a handful of participants and the other by a crowd. That's why many technical analysts check volume before trusting a breakout or a reversal.
In this article we use real daily quotes and volumes for Nvidia (NVDA), between April and October 2026, to show how to read volume and the OBV, an indicator built from it.
What trading volume is
Volume is the quantity of assets traded over a period. On a stock's daily chart, it's the number of shares that changed hands that session. Every trade has a buyer and a seller, so high volume doesn't mean "more buyers" or "more sellers": it means more interest, more people agreeing to trade at that price.
For Nvidia, the daily average over the period analyzed was 139.9 million shares. But it varied quite a bit from month to month: 166.2 million in May, 127.7 million in August, and 112.7 million in September.
One caveat: in forex, the market is decentralized and there's no single official volume. What platforms show is usually tick volume (the number of price changes) or the volume from a single source. In stocks, futures, and exchange-traded cryptocurrencies, the data is more reliable.
How to measure volume: average and OBV
Relative volume
The simplest way is comparing the day's volume with the average of the last 20 sessions. On August 27, 2026, Nvidia traded 298.9 million shares, against an average of 116.6 million over the previous 20 sessions: 298.9 ÷ 116.6 = 2.56 times the average. It was the only day in the period above 1.8 times the average.
OBV (On-Balance Volume)
The OBV, created by Joe Granville, is a running total: if the price closes higher, it adds the day's volume; if it closes lower, it subtracts it; if it closes unchanged, it stays put. The absolute value doesn't matter, the direction does. For example, from August 26 to August 27 the close rose from $209.66 to $227.98, so that day's 298.9 million were added, and the OBV went from 27.52 billion to 27.82 billion.
Real example: Nvidia's volume and OBV in 2026
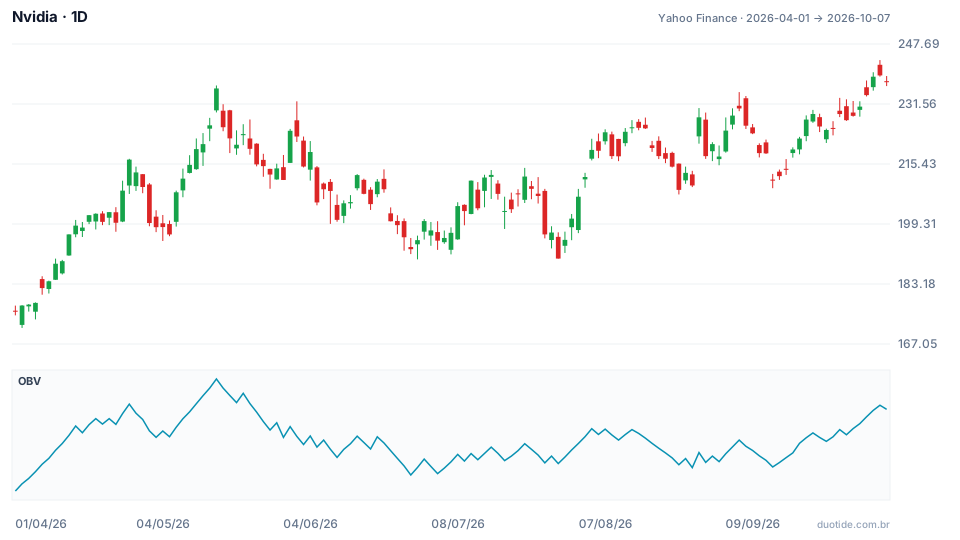
Over the period, the stock rose 35.1%, from $175.75 on April 1 to $237.47 on October 7. Three moments show what volume adds to reading price:
May: a high with heavy volume, then a correction
On May 14 Nvidia rose 4.39% and closed at $235.74, with 180.8 million shares traded, above the average of 150.2 million. It was the period's OBV peak: 29.27 billion. Ten sessions later, on May 29, the stock was at $211.14. The heavy volume confirmed interest that day, but it didn't stop the correction that followed.
August: the day of exceptional volume
On August 27 the stock jumped 8.74%, with 2.56 times the average volume. A jump like that, with so much volume, shows broad participation, not just a few isolated trades. Even so, over the following ten sessions the price pulled back 4.25%, to $218.29 on September 11. Strong volume confirms the move was real; it doesn't guarantee it continues without a pause.
October: price at a high, OBV not
On October 6 Nvidia closed at $239.24, the period's highest close, above May 14's $235.74. The OBV, though, was at 28.75 billion, below May's 29.27 billion. And volume had been falling: 101.7 million on October 6 and 81.5 million on October 7. A new price high with the OBV below its previous high is a divergence: the rally continued, but with less volume behind it. What happens after that isn't in the data; the divergence is a warning of fading strength, not a prediction of a drop.
How to use volume
Confirming breakouts
When price breaks a resistance with volume well above average, the read is that many participants accepted the new price. Breakouts on weak volume fail more often and fall back inside the previous range.
A healthy trend
In a healthy uptrend, volume tends to grow on up days and shrink on pullbacks. If the pattern flips, with drops on heavy volume and rallies on weak volume, the trend deserves more caution.
Exhaustion
Extreme volume spikes after a long move sometimes mark its end: that's when the last participants all pile in at once. The August 27 example shows that kind of day can be followed by a pause.
OBV divergences
When price makes a higher high and the OBV doesn't follow (or the opposite, at lows), there's a mismatch between price and participation, as happened with Nvidia in October.
Limitations
Volume doesn't say who was right, only how many people traded. Days with options expiration, index rebalancing, or news can inflate volume without meaning anything for the trend. The OBV adds the entire day's volume even if the move was a few cents, which can distort the reading.
Common mistakes when analyzing volume
- Thinking high volume on an up day means "more buyers than sellers": every trade has both sides.
- Comparing different assets' volume in absolute numbers, instead of comparing each one with its own average.
- Trusting forex volume as if it were the market's total volume.
- Reading the OBV's absolute value, when what matters is the direction and the divergences.
- Using volume alone, without support, resistance, and trend.
- Forgetting that the examples above describe what happened, not what will happen.
To practice, open the daily chart of a stock you follow on a demo account, add volume with the 20-period average and the OBV, and note, on every breakout, whether volume confirmed it and what the price did over the following ten sessions. After a few weeks, your own record shows whether the volume filter helps your way of trading.
Practice before you risk. Open your Duotide account and test your ideas on the demo account with US$10,000 in virtual funds.
Create free accountUpdated:
Editorial character of the Duotide newsroom. Articles are written by the team with the help of artificial intelligence; prices and charts come from real market data. Explains charts, indicators and trading strategies: how they work, where they fail and how to test them first.
Was this article helpful?
Be the first to rate it.
Comments
- No comments yet. Be the first to comment.
Ready to put it into practice?
Open your account and practice on the demo account with US$10,000 in virtual funds, without risking money.
- Secure platformProtected login and identity verification
- Multilingual supportHelp available every day
- Free demo accountUS$10,000 virtual to practice
Trading involves the risk of losing the capital invested.
