

 Português pt
 Español es
 العربية ar
 বাংলা bn
 Deutsch de
 Filipino fil
 Français fr
 हिन्दी hi
 Bahasa Indonesia id
 Italiano it
 Русский ru
 Svenska sv
 ไทย th
 Türkçe tr
 Tiếng Việt vi
 简体中文 zh
Updated:
StrategiesWoodies CCI: How the Complete System Works
 Naomi TanakaEditorial character · Analysis Desk

Quick answer
The Woodies CCI is a trading system created by Ken Wood that uses two versions of the CCI on the same panel: the 14-period one, which defines the trend, and the 6-period one, called turbo, which acts as the trigger. The zero line is the main reference: six bars on the same side signal a trend, and patterns like the zero line reject mark entries in its favor. In a sideways market, the system generates a lot of false signals.
Many people only know the CCI as an oscillator that shows whether the price is stretched up or down. The version popularized by trader Ken Wood, known as Woodie, turns the same indicator into a decision system: two lines, a trend rule, and a handful of well-defined entry patterns.
In this guide we use gold's real daily quotes (the GC=F futures contract) between April and October 2026 to show the calculation, the readings, and what the system got right and wrong over that period.
What the Woodies CCI is
The CCI (Commodity Channel Index) was created by Donald Lambert in 1980. It measures how far today's typical price is from its average, in units of the mean deviation. Readings above +100 indicate a price well above the recent normal; below −100, well below it.
Woodie's system uses two versions of the CCI on the same panel:
- Standard 14-period CCI, usually drawn as a histogram. It's the one that defines the trend.
- 6-period turbo CCI, drawn as a line. It reacts faster and acts as the trigger.
- Trend rule: six bars in a row of the 14-period CCI on the same side of the zero line signal a trend in that direction.
The difference from common usage is that the zero line, not the ±100 levels, becomes the main reference.

How to calculate the CCI
The formula has four steps:
- Typical price (TP) = (high + low + close) ÷ 3.
- Average of the TP over the last 14 periods.
- Mean deviation: the average of the absolute distances between each TP and that average.
- CCI = (TP − average) ÷ (0.015 × mean deviation).
Example with real gold data
On September 18, 2026, gold had a high of $4,439.80, a low of $4,372.20, and closed at $4,424.90.
- TP = (4,439.80 + 4,372.20 + 4,424.90) ÷ 3 = 4,412.30
- The sum of the 14 typical prices from August 31 to September 18 was 61,796.27; average = 61,796.27 ÷ 14 = 4,414.02
- Mean deviation over the same 14 days = 40.81
- CCI = (4,412.30 − 4,414.02) ÷ (0.015 × 40.81) = −1.72 ÷ 0.612 = −2.8
A CCI of −2.8 means the price was practically sitting right on its 14-day average. The 6-period turbo CCI was at 118.9 on the same day: in the short term, gold had risen hard. That combination is exactly the setup for one of the system's patterns, as we'll see next.
Real example: the Woodies CCI on gold in 2026
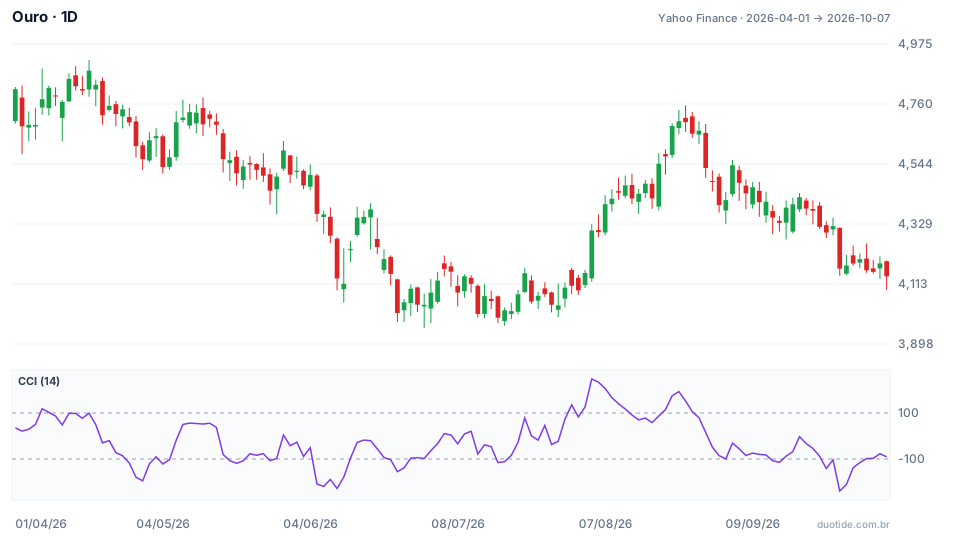
The chart shows the 14-period CCI with the +100 and −100 lines. Over the whole period, gold fell 13.97%, from $4,813.10 on April 1 to $4,140.70 on October 7. Three stretches show the system working and failing.
August: an uptrend and a turbo crossover
The 14-period CCI had stayed above zero since July 30. On August 18, after 14 positive sessions, it pulled back to 58.3 and the turbo fell to −62.8, below it. The next day the turbo climbed back to 146.8, above the 14-period CCI (87.1): the system's trigger in favor of the trend. Gold closed on August 18 at $4,420.60 and on August 24 at $4,697.80, up 6.27%.
September: a bearish zero line reject
The 14-period CCI moved below zero on August 31 and never went back to the positive side through October 7. On September 18, after 14 negative sessions, it climbed to −2.8, touched the zero line, and didn't cross it: that's the zero line reject, a bounce within the trend the indicator was already showing. On September 23 the turbo (−115.1) crossed below the 14-period CCI (−88.1). Gold closed on September 23 at $4,318.40 and on September 28 at $4,168.40, down 3.47%; from September 18, the drop was 5.80%.
July: a sideways market, lots of false signals
Between July 6 and July 30 the 14-period CCI crossed the zero line nine times, and closes stayed between $3,992.10 and $4,167.50. No trend lasted six bars, and every turbo crossover flipped into the opposite signal within a few days. This is the kind of market where the system, applied without a filter, just generates cost.

How to use the Woodies CCI
Define the trend first
Only look for longs with the 14-period CCI above zero for at least six bars, and shorts with it below zero for the same amount of time. Without that, the system says to wait.
Zero line reject
Within a trend, the 14-period CCI moves back toward zero and gets rejected, without crossing it. The entry is usually taken when the turbo crosses back in favor of the trend, as on September 23.
Trendline break on the indicator
It's also possible to draw a trendline connecting the histogram's peaks or troughs. A break of that line signals a change in strength before the price confirms it. It carries more weight when it coincides with a zero line crossover.
Risk management with real numbers
A short entered at the September 23 close, at $4,318.40, with a stop above the September 18 high ($4,439.80), would risk $121.40 per ounce. A target at twice the risk would sit at $4,075.60. Through October 7, the target wasn't reached (the lowest low was $4,091.20) and neither was the stop (the highest high was $4,351.60). At the October 7 close, at $4,140.70, the trade would be $177.70 in profit, or 1.46 times the risk. A plan with a target, a stop, and a time limit set before entry avoids deciding midway through.
Limitations
The CCI is calculated only from past price and reacts late to news. In sideways markets, like July, crossovers pile up. And the system's patterns require interpretation: what counts as close to zero for one person might not for another, which is why it's worth writing numerical rules and testing them.
Common mistakes when using the Woodies CCI
- Trading every turbo crossover without checking the six trend bars.
- Using only the ±100 levels, like with the traditional CCI, and ignoring the zero line.
- Applying the system in a sideways market, where it generates false signals one after another.
- Entering without a defined stop, or setting the target after the entry.
- Forgetting that the examples above describe what happened, not what will happen.
To practice without risking money, set up the 14-period and 6-period CCI on the asset you follow in a demo account, write the trend and entry rules down on a sheet, and record every signal and what the price did afterward over a few weeks. That record shows whether the system works in your market and your trading hours.
Practice before you risk. Open your Duotide account and test your ideas on the demo account with US$10,000 in virtual funds.
Create free accountUpdated:
Editorial character of the Duotide newsroom. Articles are written by the team with the help of artificial intelligence; prices and charts come from real market data. Explains charts, indicators and trading strategies: how they work, where they fail and how to test them first.
Was this article helpful?
Be the first to rate it.
Comments
- No comments yet. Be the first to comment.
Ready to put it into practice?
Open your account and practice on the demo account with US$10,000 in virtual funds, without risking money.
- Secure platformProtected login and identity verification
- Multilingual supportHelp available every day
- Free demo accountUS$10,000 virtual to practice
Trading involves the risk of losing the capital invested.
