

 Português pt
 Español es
 العربية ar
 বাংলা bn
 Deutsch de
 Filipino fil
 Français fr
 हिन्दी hi
 Bahasa Indonesia id
 Italiano it
 Русский ru
 Svenska sv
 ไทย th
 Türkçe tr
 Tiếng Việt vi
 简体中文 zh
Updated:
IndicatorsZig Zag and Fibonacci: Following the Trend Together
 Naomi TanakaEditorial character · Analysis Desk
Quick answer
The Zig Zag connects the chart's relevant highs and lows and ignores swings smaller than a minimum percentage, and the Fibonacci drawn over the leg it marks shows zones (38.2%, 50%, 61.8%) where a pullback tends to be watched. Together, they organize the reading of the trend, but they don't predict the reversal: the Zig Zag's last segment keeps redrawing itself, and no Fibonacci level is respected every time.
Anyone who starts watching charts quickly notices that the price never moves in a straight line. It advances, pulls back, advances again, and that saw-tooth pattern of small moves hides where the trend is actually heading. Two tools help when used together: the Zig Zag, which clears out the noise and highlights the relevant legs, and Fibonacci retracements, which give a ruler for measuring how far a pullback went.
In this guide, we use EUR/USD's real daily quotes between March and October 2026 to show the Zig Zag's drawing, the Fibonacci level calculation, and what the price actually did at each zone.
What the Zig Zag indicator is
The Zig Zag draws straight lines between the most significant highs and lows and ignores swings smaller than a minimum percentage. With the parameter set at 2%, for example, a high is only confirmed once the price drops 2% from it; a low, once the price rises 2% from it. A 1% correction in the middle of a rally simply doesn't show up in the drawing.
The most important detail: the Zig Zag's last segment isn't confirmed. Until the following move reaches the minimum percentage, the most recent point can still shift. That's why the indicator organizes what already happened, but doesn't flag the reversal the moment it occurs.

What Fibonacci retracements are
After a strong move, the price usually gives back part of the distance before continuing. The most used levels for measuring that pullback are 23.6%, 38.2%, 50%, 61.8%, and 78.6% of the leg. To draw them, you need to choose the leg's start and end, and that's where the Zig Zag helps: it's already isolated the legs, removing the doubt over which swing to use as a reference.
How to calculate the Fibonacci levels
The math is simple: level = leg's end − (leg's size × percentage). With the 2% Zig Zag on EUR/USD's daily chart, one of 2026's legs was the rally that started at the June 24 low (1.1325) and ended at the August 21 high (1.1712). The levels below were calculated from the unrounded quotes.
- Leg size: 1.1712 − 1.1325 = 0.0387, or 387 pips.
- 38.2%: 1.1712 − 0.0387 × 0.382 = 1.1565
- 50%: 1.1712 − 0.0387 × 0.5 = 1.1519
- 61.8%: 1.1712 − 0.0387 × 0.618 = 1.1473
- 78.6%: 1.1712 − 0.0387 × 0.786 = 1.1408
On a downward leg, the math flips: the levels are measured from the low, going up. In the decline from April 17 (a high of 1.1851) to June 24 (1.1325), a 526-pip leg, the 61.8% level sits at 1.1325 + 0.0526 × 0.618 = 1.1650, and the 78.6% level, at 1.1739.
Real example: Zig Zag and Fibonacci on EUR/USD in 2026
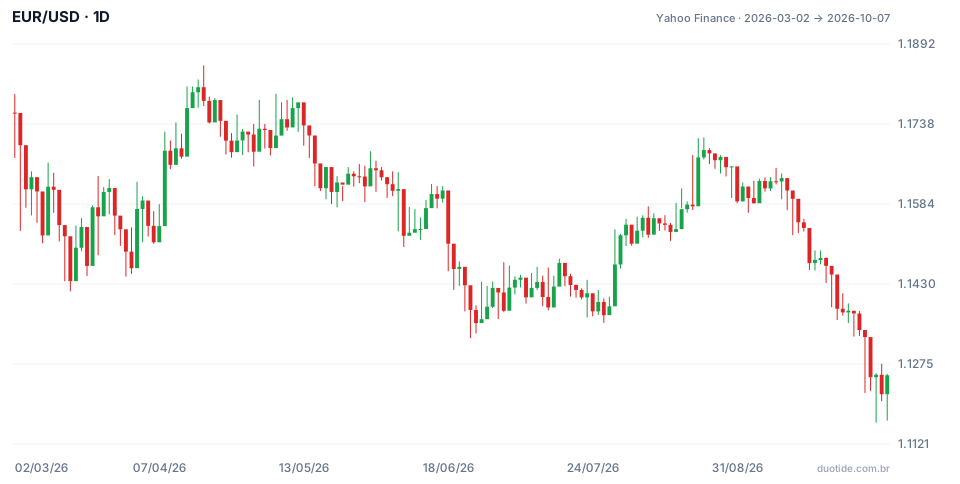
With the 2% Zig Zag, 2026's EUR/USD shows a clear sequence of lower highs: 1.2024 on January 28, 1.1851 on April 17, and 1.1712 on August 21. The lows also moved lower: 1.1416 on March 16, 1.1325 on June 24, and 1.1162 on October 5. That's the picture of a downtrend over the period, and three moments show how Fibonacci behaved within it.
July: a shallow bounce
After the June 24 low, the first bounce reached 1.1478 on July 16, only 29.1% of the previous downward leg, just above the 23.6% level (1.1449). The price fell again and marked 1.1354 on July 28. Bounces that barely pass 23.6% usually show up when selling pressure is still strong.
August: the price passed 61.8%
The next rally went farther. On August 20, EUR/USD closed at 1.1674, above the downward leg's 61.8% level (1.1650), and on August 21 it marked a high of 1.1712, a 73.6% retracement, without reaching 78.6% (1.1739). From there the pair fell again. The example shows that the levels are zones, not exact lines: anyone expecting a reaction exactly at 61.8% watched the price blow right through it.
September: the rally's levels broke one by one
In the correction of the June-to-August rally, the price came close to 38.2% (1.1565) on September 2, with a low of 1.1567, and bounced up to 1.1654 on September 9. On September 17 it closed at 1.1470, practically right on 61.8% (1.1473), and stayed there for three sessions, with closes between 1.1465 and 1.1480. On September 23 the low of 1.1385 broke through 78.6%, on September 29 the low of 1.1328 touched the leg's start, and on October 1 the price marked 1.1219, below June's low. The entire rally was given back, and the market made a lower low, confirming the downward sequence. From August 21 to October 5, the decline was 550 pips.
Also notice the last segment: the October 5 low at 1.1162 isn't yet confirmed by the 2% Zig Zag, because the price would need to rise 2%, to near 1.1386, for that. Until then, that point can still move.
How to use Zig Zag and Fibonacci together
1. Choose the leg with the Zig Zag
Apply the Zig Zag with a percentage that fits the asset and the timeframe. On EUR/USD's daily chart, 2% showed the main legs; 1% produced about 30 points over the year, including a high and a low on the same day. On stocks and crypto, which swing more, the percentage tends to be bigger.
2. Draw Fibonacci from the leg's start to its end
Use the highs and lows of the candles the Zig Zag marked, always in the leg's direction. In a downtrend, the pullbacks are rallies and the levels sit above the low; in an uptrend, they sit below the high.
3. Wait for the price to reach the zone and look for confirmation
The 38.2%-to-61.8% band is the most closely watched. A touch, on its own, isn't a signal: look for a reversal candle pattern, a loss of strength on an oscillator like the RSI, or a change in the price's behavior before making any decision.
4. Use the break as information
When the price crosses past 78.6% and the leg's starting point, as in September, the reading changes: the previous leg has been invalidated. That's also useful information, because it says the bigger trend is still in control.
Limitations
The Zig Zag is recalculated with every new price and only confirms a point after the next move happens. Fibonacci depends entirely on the points chosen: two people using different Zig Zag percentages draw different levels. Neither one accounts for news, interest rates, or flow, and in a sideways market the levels lose relevance.
Common mistakes when using Zig Zag and Fibonacci
- Treating the Zig Zag's last point as a confirmed high or low and trading off it.
- Testing an indicator that redraws itself by looking at the past and concluding it nails every reversal.
- Expecting an exact reaction at 61.8%: in August EUR/USD passed that level and only turned near 73.6%.
- Changing Fibonacci's reference points after the fact so the levels look like they worked.
- Entering just because the price touched a level, with no confirmation and no stop set beforehand.
- Forgetting that the examples above describe what happened, not what will happen.
To train without risking money, open the chart of the asset you follow in a demo account, apply the Zig Zag, draw Fibonacci over the most recent legs, and note, over a few weeks, which level each pullback stopped at and what came after. That record shows what the levels are really worth in your market.
Practice before you risk. Open your Duotide account and test your ideas on the demo account with US$10,000 in virtual funds.
Create free accountUpdated:
Editorial character of the Duotide newsroom. Articles are written by the team with the help of artificial intelligence; prices and charts come from real market data. Explains charts, indicators and trading strategies: how they work, where they fail and how to test them first.
Was this article helpful?
Be the first to rate it.
Comments
- No comments yet. Be the first to comment.
Ready to put it into practice?
Open your account and practice on the demo account with US$10,000 in virtual funds, without risking money.
- Secure platformProtected login and identity verification
- Multilingual supportHelp available every day
- Free demo accountUS$10,000 virtual to practice
Trading involves the risk of losing the capital invested.
