

 Português pt
 Español es
 العربية ar
 বাংলা bn
 Deutsch de
 Filipino fil
 Français fr
 हिन्दी hi
 Bahasa Indonesia id
 Italiano it
 Русский ru
 Svenska sv
 ไทย th
 Türkçe tr
 Tiếng Việt vi
 简体中文 zh
Updated:
IndicatorsBollinger Bands: How to Calculate and 3 Ways to Use Them
 Naomi TanakaEditorial character · Analysis Desk

Quick answer
Bollinger Bands are three lines: a 20-period moving average and two bands set two standard deviations above and below it. They're used in three ways: measuring volatility through the width of the bands, trading the reversal when price moves back inside them in a sideways market, and following the breakout after a squeeze. Touching the band isn't an automatic buy or sell signal.
Bollinger Bands were created by John Bollinger in the 1980s and bring together, in a single tool, a trend reading and a volatility reading. A lot of people recognize the three lines on the chart, but use the indicator in just one way, usually selling when price touches the upper band. That's exactly the use that goes wrong most often.
In this guide, we use real daily quotes for gold (the Comex futures contract, via Yahoo Finance) between March and October 2026 to show the calculation and the three ways to use it, including the times each one failed.
What Bollinger Bands are
They're three lines drawn over price. The middle one is a simple moving average, usually over 20 periods. The other two sit above and below it, at a distance of two standard deviations of price over that same 20 periods. When price swings a lot, the standard deviation grows and the bands move apart; when price sits still, they come closer together.

How to calculate Bollinger Bands
- Middle band: simple average of the last 20 closes.
- Standard deviation: how much, on average, those 20 closes stray from the average.
- Upper band: average + 2 × standard deviation.
- Lower band: average − 2 × standard deviation.
Example with real gold data
On August 4, 2026, the average of gold's previous 20 closes was US$ 4,072.12, and the standard deviation of those closes was US$ 45.77.
- Upper band = 4,072.12 + 2 × 45.77 = US$ 4,163.65
- Lower band = 4,072.12 − 2 × 45.77 = US$ 3,980.59
- Band width = 4,163.65 − 3,980.59 = US$ 183.06, or 4.5% of the average
For comparison: on March 27, the width was US$ 1,249.66, or 25.5% of the average. Same formula, almost six times the volatility.
Real example: the bands on gold in 2026
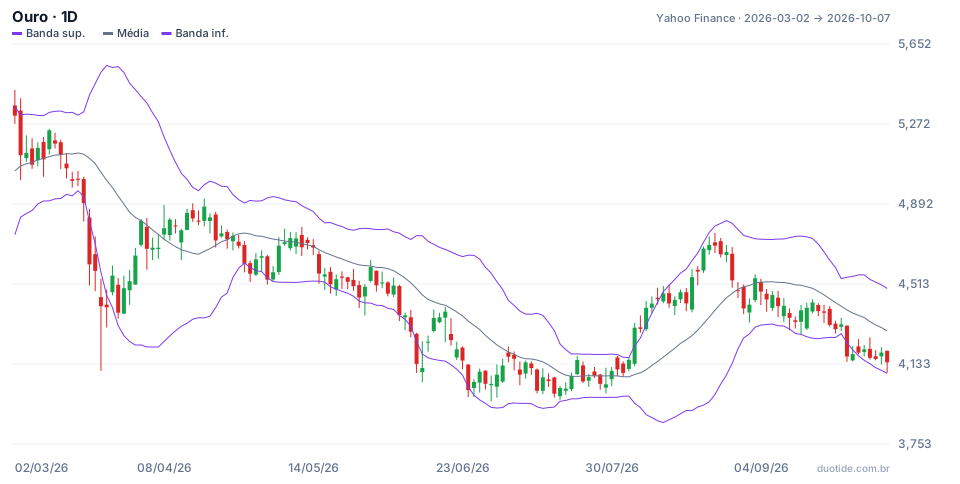
Over the chart's period, gold fell 22.04%, from US$ 5,311.60 to US$ 4,140.70, with a high of US$ 5,434.10 on March 2 and a low of US$ 3,955.40 on June 30. Three moments illustrate the three ways to use the indicator.
March: price hugging the lower band
On March 19 gold closed at US$ 4,605.70, below the lower band (US$ 4,809.21). It closed below it again on March 20, March 23, and March 24. Anyone who bought on March 19 just because price pierced the band saw US$ 4,402.00 on March 24, 4.4% lower, and an intraday low of US$ 4,100.00 on March 23. In a strong downtrend, the band isn't a floor.
June: the reversal that worked for a few days
On June 10 and June 11 price closed below the lower band. On June 12 it moved back inside, to US$ 4,238.80, and on June 17 it closed at US$ 4,381.40, up 3.4%, near the 20-period average (US$ 4,411.53). But the downtrend continued: on June 24 gold closed below the band again, at US$ 4,008.80.
August: squeeze and breakout
Between mid-July and early August the bands narrowed to the period's smallest width, the US$ 183.06 seen on August 4. On August 5 gold closed at US$ 4,305.20, above the upper band (US$ 4,220.10), and kept closing above it through August 11. By August 24 it was at US$ 4,697.80, 9.1% above the breakout close. The examples describe what happened, not what will happen.

How to use Bollinger Bands
Way 1: measure volatility by the width
Narrow bands show a quiet market; wide bands, an agitated one. After a strong squeeze, like the one in August, a big move is common. This use doesn't tell direction: it serves to adjust position size and stop distance before the move arrives.
Way 2: trade the reversal at the edges
In a sideways market, price tends to return to the average after leaving the bands. The most common signal isn't the touch, but the close back inside the band, as on June 12. Combine it with another momentum indicator, like the RSI, and with the larger-timeframe trend.
Way 3: follow the breakout
After a squeeze, a close outside the band with a large-bodied candle can mark the start of a trend, as on August 5. Here the logic is the opposite of way 2: you enter with the move, not against it.
Limitations
The bands use past prices and react with a lag. Whether the market is sideways (way 2) or starting a trend (way 3) only becomes clear afterward. And two standard deviations don't mean 95% of prices will stay inside the bands: market prices don't follow a normal distribution, and gold spent several consecutive days outside them in both March and August.
Common mistakes when using Bollinger Bands
- Automatically selling when price touches the upper band, or buying at the lower one, in a strongly trending market.
- Mixing ways 2 and 3 without criteria, entering against the move one day and with it the next.
- Treating a squeeze as a buy signal, when it only warns that volatility should increase.
- Changing the period or the number of deviations without testing first.
- Using the indicator alone, without support, resistance, volume, or another confirming indicator.
To practice, open the daily chart of the asset you follow on a demo account, add Bollinger Bands with 20 periods and 2 deviations, and note, over a few weeks, every close outside the bands and what price did in the following days. Separate the cases into sideways and trending: your own record will show which of the three ways works best on your asset.
Practice before you risk. Open your Duotide account and test your ideas on the demo account with US$10,000 in virtual funds.
Create free accountUpdated:
Editorial character of the Duotide newsroom. Articles are written by the team with the help of artificial intelligence; prices and charts come from real market data. Explains charts, indicators and trading strategies: how they work, where they fail and how to test them first.
Was this article helpful?
Be the first to rate it.
Comments
- No comments yet. Be the first to comment.
Ready to put it into practice?
Open your account and practice on the demo account with US$10,000 in virtual funds, without risking money.
- Secure platformProtected login and identity verification
- Multilingual supportHelp available every day
- Free demo accountUS$10,000 virtual to practice
Trading involves the risk of losing the capital invested.
