

 Português pt
 Español es
 العربية ar
 বাংলা bn
 Deutsch de
 Filipino fil
 Français fr
 हिन्दी hi
 Bahasa Indonesia id
 Italiano it
 Русский ru
 Svenska sv
 ไทย th
 Türkçe tr
 Tiếng Việt vi
 简体中文 zh
Updated:
StrategiesThe 5-3-1 Rule in Trading: What It Is and How to Apply It
 Naomi TanakaEditorial character · Analysis Desk

Quick answer
The 5-3-1 rule is a focus method: follow at most 5 assets, master at most 3 strategies, and trade at 1 fixed time of day. The idea is to trade shallow knowledge of many markets for deep knowledge of a few. It organizes the routine, but doesn't guarantee a profit: the result still depends on each trade's risk management.
One of the biggest enemies for anyone starting to trade isn't a lack of information, it's too much of it. There are dozens of indicators, hundreds of assets, and new content every day, and it's easy to spend months hopping from one method to another without mastering any of them. The 5-3-1 rule is a practical answer to that problem: a simple way to limit choices and create focus.
In this guide, besides explaining the rule, we use real daily quotes for five currency pairs between April and October 2026 to show how to choose the assets and why the position size needs to change when volatility changes.
What the 5-3-1 Rule Is
The rule was born in the forex market, but the logic applies to stocks, indexes, and cryptocurrencies. Each number limits a choice:
- 5 assets: follow at most five pairs or markets properly, instead of monitoring dozens at once.
- 3 strategies: master at most three entry setups, studied in depth, instead of switching methods every week.
- 1 time slot: always trade in the same window of the day, preferably when those assets have the most liquidity.
Behind the numbers is a simple idea: each asset has its own behavior, each strategy needs practice to be executed without hesitation, and each time slot has a different volume dynamic. Anyone following everything at once ends up with shallow knowledge of each part. Anyone following few things starts noticing details, like the price range an asset usually reacts at or the time it gains volume.

How to Build Your 5-3-1 Rule
Step 1: Choose the 5 Assets
Prefer assets with good liquidity that you understand. An objective criterion is volatility: mixing very calm assets with very jumpy ones makes it harder to compare results and calibrate the stop. The ATR (average true range) measures how much the asset moves per day and works well for that comparison.
Step 2: Set the 3 Strategies
Choose setups that differ from each other, for different situations: for example, a trend continuation one, a breakout one, and a reversal one at support or resistance. Write down the entry, stop, and target rules for each before trading.
Step 3: Fix 1 Time Slot
In forex, the London and New York session overlap, between late morning and early afternoon Brasília time, usually concentrates volume in dollar pairs. What matters is that the time be the same every day and fit your routine.
Practical Example: Choosing the 5 Pairs with Real Data
We calculated the 14-day ATR of five currency pairs between April 1, 2026 and October 7, 2026 (136 trading days, Yahoo Finance data) and divided it by the price, to get the average daily range as a percentage:
- EUR/USD: 0.55% per day, on average.
- GBP/USD: 0.64%.
- USD/JPY: 0.67%.
- AUD/USD: 0.81%.
- USD/BRL: 1.31%.
The first four move within a similar range. USD/BRL moved, on average, 2.4 times more than EUR/USD per day (1.31 ÷ 0.55). That doesn't rule it out of the list, but it means a stop of the same percentage size would be hit far more often on it. If it makes the five, it needs its own stop and position.
EUR/USD's ATR Throughout 2026
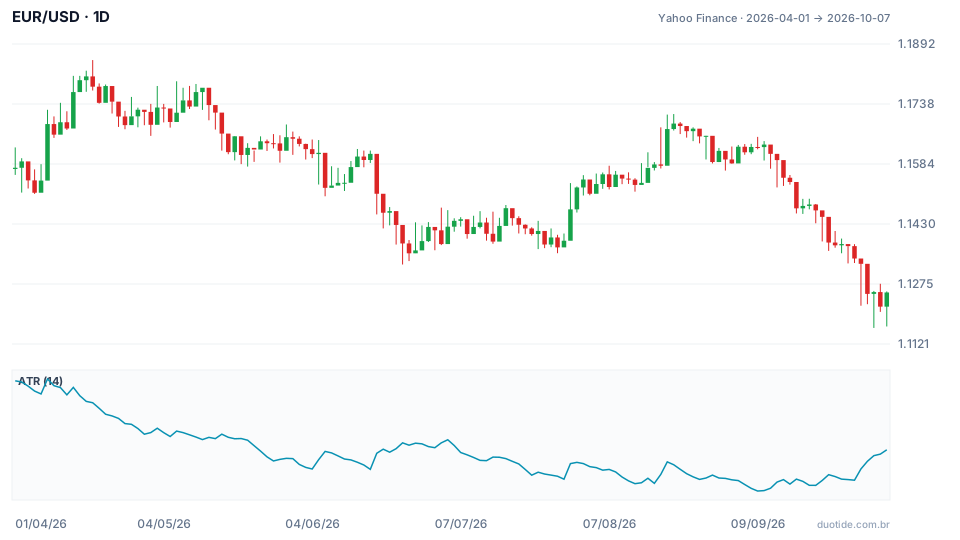
The chart shows EUR/USD and, in the lower panel, the 14-day ATR. Three moments show why volatility matters even for someone following only five assets:
- April 8, 2026: the ATR reached the period's highest value, 0.00965, or about 97 pips a day, with the pair at 1.1687. April's average was 86 pips.
- September 9, 2026: the ATR fell to its lowest value, 0.00473, or 47 pips, with the pair at 1.1627. September's average was 51 pips: the same asset was moving at practically half of what it moved in April.
- October 7, 2026: the ATR climbed back to 0.00654 (65 pips), after the pair fell from 1.1627 on September 9 to 1.1254, a 3.2% drop in less than a month.
Position Size with the Real ATR
Suppose a $5,000 account that risks 1% per trade ($50) and a stop of 1.5 ATR. On a standard EUR/USD lot, each pip is worth about $10.
- April 8 (ATR of 97 pips): a 145-pip stop → 50 ÷ (145 × 10) = 0.03 lots.
- September 9 (ATR of 47 pips): a 71-pip stop → 50 ÷ (71 × 10) = 0.07 lots.
- October 7 (ATR of 65 pips): a 98-pip stop → 50 ÷ (98 × 10) = 0.05 lots.
The dollar risk was the same in all three cases; the position size more than doubled between April and September. This is the kind of adjustment that becomes natural when you follow a few assets closely.

How to Use the 5-3-1 Rule Day to Day
Make a Profile for Each Asset
For each of the five, note the average ATR, the hours of biggest movement, the release dates that usually move it (interest rates, employment, inflation), and the price levels you watch. Update the profile once a week.
Test Each Strategy Separately
Log the trades by setup. After 30 to 50 trades for each one, you'll have numbers to compare: win rate, average gain, average loss. Only then decide whether any should be dropped.
Respect the Time Slot Even Without a Signal
Days with no opportunity within your window are part of it. Trading outside the time slot because the day was slow is one of the most common ways to break the rule.
Review the List with a Criterion
Swapping an asset is allowed, but for a reason: liquidity dropped, volatility shifted to a different level, you understand little of what moves that market. A review every quarter is enough.
Limitations
The rule organizes your study and routine; it doesn't create a statistical edge on its own. Five dollar pairs can move together on days with American news, which concentrates the risk. And the exact numbers (5, 3, 1) are a convention, not a law: anyone working part-time might prefer 3-2-1.
Common Mistakes When Applying the 5-3-1 Rule
- Choosing the five assets by what's trending that week, instead of liquidity and understanding of what moves them.
- Using the same percentage stop for assets with very different volatility, like EUR/USD and USD/BRL.
- Keeping the same position size when the ATR shifts to a different level.
- Having three strategies that, in practice, are the same entry with different names.
- Giving up the fixed time slot on days with no signal.
- Ignoring that several dollar pairs can fall or rise together, adding up the risk of trades open at the same time.
To practice without risking money, build your list of five assets in a demo account, calculate each one's ATR, and trade only the three setups, always at the same time, for a few weeks. Log every trade and compare the numbers at the end of the month: the examples above describe what happened in 2026, not what's going to happen.
Practice before you risk. Open your Duotide account and test your ideas on the demo account with US$10,000 in virtual funds.
Create free accountUpdated:
Editorial character of the Duotide newsroom. Articles are written by the team with the help of artificial intelligence; prices and charts come from real market data. Explains charts, indicators and trading strategies: how they work, where they fail and how to test them first.
Was this article helpful?
Be the first to rate it.
Comments
- No comments yet. Be the first to comment.
Ready to put it into practice?
Open your account and practice on the demo account with US$10,000 in virtual funds, without risking money.
- Secure platformProtected login and identity verification
- Multilingual supportHelp available every day
- Free demo accountUS$10,000 virtual to practice
Trading involves the risk of losing the capital invested.
